A program for detecting wifi signals. WiFi SiStr is a free utility for displaying the signal strength of Wi-Fi networks. Updating the router firmware
To work with large wireless networks, there are a sufficient number of good multifunctional software solutions on the market that allow you to perform comprehensive testing of WiFi networks. However, you will often find it easier to use simpler, free tools to get a quick glimpse of the airwaves during design, deployment, or troubleshooting. We present to your attention an overview of the most interesting free programs for diagnosing WiFi networks.
As part of this article, we will present you nine free software tools - most of them running on Windows operating systems, others on macOS or Android - that will give you basic information about existing WiFi signals in range: SSIDs, signal strength channels used, MAC addresses and types of protection of a particular network. Some of them can detect hidden SSIDs, detect noise levels, or provide statistics on the success and failure of your wireless connection's sent and received packets. One solution includes a WiFi password cracking toolkit that will be extremely useful for finding vulnerabilities and assessing security when testing your wireless network's security against hacking.
Note also that most of the tools described below are free versions of commercial solutions distributed by the same vendor, but with reduced functionality.

Wireless scanner local area networks Acrylic WiFi Home is a stripped-down version of Tarlogic Security's commercial solution. Version 3.1, covered in this review article, attracts attention, primarily due to the granularity of the wireless environment and advanced graphical capabilities for displaying the collected information. The functionality of this solution includes: an overview of the found WiFi networks supporting 802.11 a / b / g / n / ac standards; detection of unauthorized access points and display of connected clients; scanning and analysis of WiFi channels used by wireless networks at 2.4 GHz and 5 GHz; building graphs of the received signal level and its power for WiFi access points.
Acrylic WiFi Home WiFi scanner for Windows will allow you to scan and view available wireless networks in real time, provide information about detected WiFi networks (SSID and BSSID), their type of protection and wireless devices connected to the network in this moment and also allows you to get a list of WiFi passwords (set by default by manufacturers) thanks to the built-in plugin system.
Being free product Acrylic WiFi Home 3.1 has a simple yet attractive graphical interface... A detailed list of SSIDs is located at the top of the app. Here, in particular, you can find: negative values in dBm for the indicator of the received signal strength indicator (RSSI), supported by access points or WiFi-routers 802.11 standard (including 802.11ac), manufacturer name, model and MAC addresses network devices... The solution recognizes the used bandwidth and displays all the channels used for this. It does not look for hidden SSIDs, but it can show them if it finds network data that indicates the presence of hidden networks. The application also has functionality for inventorying the operation of WiFi networks, allowing you to assign and save the names of detected SSIDs and / or clients (for the free version, this feature has quantitative restrictions on use).
At the bottom of the application screen, by default, visual rating information for network characteristics selected SSID. There is also a graph of the signal strength and power of all detected access points. When you switch to the advanced mode of displaying the status of wireless networks, you will receive two additional graphs - for the 2.4 GHz and 5 GHz bands - which simultaneously display both information about the channels used, including those combined into one "wide" channel, and signal level data.
It is extremely inconvenient to export or save the captured data, since the development company software decided to cut this functionality excessively in a free solution: you can copy no more than one line of data to the clipboard and then paste the text into Text Document or a spreadsheet. There is also a function to post a screenshot to Twitter.
Overall, Acrylic WiFi Home is a good software WLAN scanner, especially considering that it costs nothing. It collects all the basic information about your wireless space and clearly demonstrates the received data, both in text and graphically which is perfect for simple WiFi diagnostics. The main disadvantage of this solution can be considered big problems with data export, or rather, the actual lack of such an opportunity in view of the functionality cut by the manufacturer itself in the free solution.
AirScout Live (Android)

Greenlee's AirScout Live app turns your Android smartphone into a handy and portable WiFi analyzer. AirScout Live has seven modes of operation, four of which can be used completely free of charge without any restrictions for Android devices. The commercial version, unlike the free one, is compatible with most desktop computers (Windows) and mobile devices(Android and iOS). With the help of the basic functionality, you can quickly, mobile and, importantly, solve problems related to insufficient WiFi signal in some places of your office or home for free.
AirScout live will show all the characteristics of the access points detected in the range: from signal strength and security protocols to equipment capabilities. Allows you to determine the least congested channel, measure the signal strength at each point of the WiFi network and identify places with insufficient signal strength. It will help identify sources of interference by analyzing channel usage parameters in the 2.4 GHz and 5 GHz bands. Using the program, you can choose the optimal location for the location of the access points in order to provide the best quality WiFi coverage of the premises and configure it to maximum performance without buying additional equipment. In addition, the AirScout app allows you to take snapshots of the WiFi network and save locally or upload them to the cloud.
AirScout Live is a very easy-to-use application that does not require additional training... The user interface looks attractive and intuitive. The first two menu items - "AP Chart" and "AP Table" - will provide you with visual and comprehensive information about all the characteristics of access points that are in sight. Access point coverage graphs will visually show you the dependence of the signal level of each of them and the channel load in the 2.4 GHz and 5 GHz bands. Extended tabular information about each access point (SSID, Mac address, hardware vendor, channel used, channel width, received signal level in dBm and security settings) are available in the second menu item.
The "Timeline" item will allow you to see all the access points that your Android device has detected in the observed location, and their graph of signal level changes in dBm with reference to time. So, for example, if you are exploring a network that consists of multiple access points, this information will help you understand what signal level each of them will be in a given location, and how the client device will switch between them. In addition, the choice of a specific access point highlights its signal strength, which helps the visual perception of information.
The "Signal Strength" item will allow you to visually test the signal strength for each access point over time. You can select a specific SSID and see the current, as well as the minimum and maximum level signal captured by the device for this access point. The original interpretation of the results obtained in the form of a red-yellow-green speedometer will make it possible to visually make sure whether this or that function will work in this particular place or not. For example, a stable finding of the signal level in the green zone will tell you that here you will not have problems with such resource-intensive technologies as voice over IP or transmission streaming video in Full HD format. Being in the yellow zone will indicate the availability of only web surfing. Well, the red zone will mean big problems with signal reception from this access point in this place.
To use additional functions that are not available in the free version of the software without additional equipment (identification of the most common problems: suboptimal signal coverage or incorrect channel selection; identification of sources of interference, including from "non-WiFi" devices; optimization of WiFi network configurations adjacent to 802.15.4 networks; tune WiFi performance by comparing signal strength and utilization; Ookla speed test and more) you need an AirScout controller or kit that includes a controller and remote clients.
AirScout Live is a great app that, above all, attracts with its mobility. Agree, having a tool that will always be at hand is worth a lot. The free version of the product provides you with all the information you need to quickly analyze the health of small office or home WiFi networks and identify underlying performance issues. Intuitively clear interface and competent graphic design of the obtained measurement results not only leave a good impression, but also help speed up the work with the application.

Cain & Abel is a multipurpose application for Windows operating systems for recovering and cracking passwords, which is also equipped with tools for intercepting and analyzing network traffic, including WiFi networks. Like the previous solution (Acrylic WiFi Home), Cain & Abel is a powerful network analyzer capable of capturing and processing most of the wireless network traffic.
Its graphical interface has a relatively ancient, simplistic look. The toolbar (old style with icons at the top of the screen) is used to launch various utilities. Access to the main functional parts of the application is carried out through the tabs of the windows.
Through the “Wireless” tab, we get access to functional tools for analyzing WiFi network traffic. In addition to the usual information about SSIDs and various information about signals, here you can also find a list and detailed information about connected clients. For access points and clients, Cain & Abel provides information on the number of packets detected: all packets, WEP Initialization Vector (WEP IV) security protocol initialization vectors, and ARP requests. Any hidden SSIDs found from captured packets will be displayed in the GUI. Most of the intercepted statuses and data can be exported to a simple text file.
Despite the huge functional potential of this solution, such shortcomings as the lack of visual graphs, as well as the inability to recognize 802.11ac access points and determine wider channels, do not allow us to call Cain & Abel the best choice for monitoring and analyzing WiFi networks. This solution is worth considering if your tasks go far beyond simple traffic analysis. With it, you can recover passwords for Windows OS, launch attacks to obtain lost credentials, study VoIP data on the network, analyze packet routing, and much more. This is a really powerful toolkit for system administrator with broad powers.

Ekahau HeatMapper is a mapping software tool for deploying small wireless networks at home and determining the optimal location for installing an AP. This is a simplified free version professional solutions from the Ekahau company. The software provides the same network information as a WiFi WiFi scanner, but also generates a WiFi heatmap so you can visualize signal levels. Within the framework of of this review we will talk about version 1.1.4.
The software offers the ability to create a plan or model of the object that is being investigated, as well as design a wireless network topology on a grid for approximate orientation.
On the left side of the main screen user interface a list of wireless networks and their data is displayed, sorted by signal, channel, SSID, MAC address and security type. This list includes basic information, but does not include dBm signal level and percentage values. In addition, the application does not recognize 802.11ac-enabled networks, treating them as 802.11n.
Using Ekahau HeatMapper, as with other mapping tools, you mark your current location on a map as you walk around a building to generate a heatmap of WiFi coverage. Ekahau HeatMapper will automatically calculate the location of the hotspots and place them on the map. After all the data is collected, an interactive heatmap of WiFi coverage is generated. So, for example, when you hover the cursor over the access point icon, its coverage will be separately highlighted; and when you hover over an area of the heat map, a pop-up window will pop up a hint for the received signal level with a negative dBm value for that point.
According to reviews, the Ekahau HeatMapper software solution is an oversimplified WiFi map scanner: the manufacturers removed almost all additional functionality from the free version, making this decision really home version. Also, the only export or save option available is to simply take a screenshot of the map.
However, the Ekahau HeatMapper solution can be used for small networks or to get a basic understanding of how more professional map-based tools work.

Homedale Software Utility is a relatively simple and portable (no installation required) wireless network scanner for Windows (currently version 1.75 available) and macOS (currently available version 1.03) with an optional command line interface. In addition to displaying basic information about wireless networks and signals, this utility also supports positioning using GPS and other positioning technologies.
This utility has a simple graphical interface that looks more like a multi-tabbed dialog box than a full-fledged application. The first tab "Adapters" displays a list of all network adapters, as well as their IP gateways and MAC addresses.
The Access Points tab contains many important information... There is no information about the 802.11 standard for each SSID, but here you will find all supported data rates, as well as the numbers of all channels used by each SSID at a given time, including those with a larger channel width. There is also no listing of hidden networks, but other network data is shown that indicate the presence of hidden SSIDs. Also very useful function is the ability to save notes for individual SSIDs, which can then be included in any data export.
In the Access Point Signal Graph tab, you will find the change in negative values in dBm for the received signal strength indicator over time for all selected SSIDs. The implementation of access to this functionality cannot be called very convenient and intuitive - the choice of wireless networks for monitoring and comparison is made by double-clicking on the desired SSID from the list of the previous "Access Points" tab.
The "Frequency of use" tab illustrates in real time a graphical dependence of the frequencies used by each SSID (for convenience, divided into channels) and the signal strength values. The channel usage visualization is displayed for the 2.4 GHz band and each subset of the 5 GHz band. The utility performs its task - visually demonstrates the occupancy of each channel - but it would be more convenient if we had the opportunity to have a single idea of the 5 GHz frequency, instead of dividing it into four separate graphs.
In addition, Homedale offers excellent opportunities for both free app to export the collected data. Thus, it supports saving the network list in a tabular form in CSV format, recording the results of each scan in the log (useful if you move around during the scan), as well as saving an image of each graph.
Despite its very simple graphical user interface, Homedale provides more advanced functionality than you would expect from it. In addition, I would like to note the rather impressive, both for free software, the ability to record and export data, as well as location.

LizardSystems offers a free version of its WiFi Scanner software for non-commercial use, which has the same features and functionality as their paid product. Version 3.4 of the solution is currently available. Besides WiFi scanner, this solution also offers excellent functionality for analysis and reporting.
The application has a modern graphical interface, intuitive and easy to use. The Scanner tab contains a list of detected SSIDs. In addition to the standard detailed information, here you will also find signal level values both in negative dBm values and in percentages. It even shows the number of clients that are connected to each SSID. Also, along with the specification of 802.11 standards, the solution can define and report multiple channels used by any SSID with a larger channel width.
You can use the list of visible SSIDs to filter the input by the following parameters: signal level, supported 802.11 standard, security types and used frequency bands. At the bottom of the Scanner tab are charts that you can switch between. In addition to typical graphs showing signal strength and used channels, visualized data on data transfer rate, channel utilization and number of clients is also available. The bottom of the screen displays information about the current connection. In the "Advanced Information" tab, you will find various data about network activity, down to the number of unprocessed packets.
The Current Connection tab displays more than detailed information current wireless connection. This is where you can access and manage the list of wireless profiles saved in Windows 10, which can be useful as this latest version of the Windows operating system no longer provides native access and management of this list. In the tab "Statistics wireless communication»Presents graphs and statistics for different types packets for both the physical (PHY) layer and the link (MAC) layer, which will be useful for advanced network analysis.
LizardSystems WiFi Scanner software solution offers advanced export and reporting capabilities. Basic functionality allows you to save the list of networks in text file... In addition, you can generate reports briefly describing the types of networks found by scanning, with all registered SSIDs, any comments you added, and graph snapshots. These are pretty impressive features for a free WiFi scanner.
Thus, LizardSystems' WiFi Scanner really impresses with its functionality, including filtering and reporting capabilities, as well as advanced information about transmitted data packets. It can be an important part of your travel toolbox for maintaining and testing WiFi networks, but remember that the free license is only available for personal use.
NetSpot (Windows and macOS)

NetSpot App is a software solution for researching, analyzing and improving WiFi networks. The commercial version uses mapping tools for thermal imaging of coverage areas, but it is not available in the free version for home use. However, this solution is proposed for both operating rooms. Windows networks and macOS. In this review article, we will look at NetSpot Free version 2.8 is a free, significantly stripped-down version of the company's paid products for home and corporate use.
The NetSpot Discover tab is a WiFi scanner. Despite its simple graphical interface, it has a modern appearance and the network details of each SSID are displayed in bold and are clearly visible. Signal levels are shown in negative dBm values (current, minimum and maximum), as well as percentage. Hidden networks are not displayed in the free version, as well as the ability to export data is not supported (although there is such a button, it is not active).
When you click on the "Details" button at the bottom of the application window, the combined graphs of signals and channels used for each WiFi range are shown, generated for the SSIDs selected from the list. In addition, the signaling information for each SSID is displayed in a tabular form so you can see the exact values the application gets from each scan.
Overall, the free version of NetSpot does a good job of detecting WiFi networks (although it doesn't support hidden networks). And yet, the free solution has very limited functionality, which is eloquently indicated by broken links to a large number additional opportunities- this is the inaccessibility of visualizations, and the inability to use a heat map, and the lack of export.
WirelessNetView (Windows)

WirelessNetView is a small utility from the NirSoft web resource that runs in the background and monitors the activity of wireless networks around you. It is offered free of charge for personal and commercial purposes. This is a fairly basic WiFi scanner, available in both handheld and installation configurations. Within the framework of this article, version 1.75 is considered.
WirelessNetView's graphical user interface is not very sophisticated - it's just a window listing the wireless networks. For each detected network, the following information is available: SSID, signal quality at the current time, average signal quality for the entire observation time, detection counter, authentication algorithm, information encryption algorithm, MAC address, RSSI, channel frequency, channel number, etc. ...
Thus, this utility provides signal level indicators in negative dBm values, as well as in percentages for the last received signal and the average for the entire observation period. But it would be even better if we also had access to the average values for the RSSI of a particular access point over the entire observation time. Another unique piece of the analytics available that WirelessNetView offers is how often each SSID is detected, which can be useful in certain situations.
Double-clicking on any of the detected wireless networks will open a dialog box with all the information about a specific network, which can be very convenient, since your screen is clearly not wide enough to view all the details in the main list. Right-clicking on any network in the list will save the data for that specific wireless network or all detected networks to text or HTML files. The Options toolbar menu displays some options and additional functionality, such as filtering, MAC address formatting, and other display preferences.
Please note that this utility lacks a number of advanced features that we would expect to see in modern WiFi scanners. First of all, we are talking about a graphical presentation of information, full support for the 802.11ac standard and, accordingly, recognition of all channels occupied by an access point, which can use a large channel width. However, the WirelessNetView solution can still be useful for simply monitoring wireless networks or small WiFi spaces, especially if you find some of the unique functionality of this utility valuable to yourself.
Wireless Diagnostics (macOS)

OS X Mountain Lion v10.8.4 and later operating systems Apple provides the Wireless Diagnostics tool. It is more than just a WiFi scanner; it can help detect and fix WiFi connection problems. Best of all, it is the native toolkit included with the operating system. As part of this review, we will take a look at the Wireless Diagnostics software solution included with macOS High sierra(version 10.13).
To get started, press the Option key and then click on the Airport / WiFi icon at the top of MacOS. You will have more information about your current WiFi connection, as well as access to the "Wireless Diagnostics" shortcut.
Opening Wireless Diagnostics will launch a wizard called “Assistant,” which may ask for additional information such as the make and model of the router and its location. Tests will then run to detect problems. Once verified, a summary of the results will be shown, and clicking the icon for each result will show extended details and suggestions.
While not entirely obvious, there are more tools available to you as well, not just the aforementioned wizard. While the wizard dialog box is open, clicking the Window button at the top of the toolbar will provide access to additional utilities.
Scan Utility is a simple WiFi scanner showing common data about detected wireless networks as well as short description types of networks and best channels... One of its main advantages is that it shows noise levels in WiFi channels that most of the Windows scanners presented in this article do not. However, it would be more convenient if all channels that use specific SSIDs with a larger channel width were listed, and not just the channel width and center channel would be shown.
The Info utility demonstrates the current network connection and detailed information on signal characteristics. The Logs utility allows you to configure the WiFi, EAPOL and Bluetooth diagnostic protocols. The Performance utility shows line graphs of signal and noise, signal quality and data rate of the current connection. The Sniffer utility allows you to capture raw wireless packets, which can then be exported to a third-party packet sniffer.
Thus, the utilities included in the Wireless Diagnostics toolkit of the family of operating macOS systems really impressive, especially when compared to the native wireless toolkit for Windows operating systems. You always have a WiFi scanner (which even shows noise levels) and packet capture (exportable) at your fingertips, and their Troubleshooting Assistant seems really smart. However, for the visualization of WiFi channels, in our opinion, there is not enough channel usage graph.
In addition, to obtain additional information Apple offers an excellent tour and guide to using Wireless Diagnostics.
conclusions
Each of the diagnostic programs we have considered WiFi networks has its advantages and disadvantages. At the same time, all these solutions, judging by the feedback from users, are worthy of being downloaded and evaluated in action. The choice of the optimal program for each specific case will be different. So try it!
See also:
Today I will tell you about a very convenient and useful, but, for some reason, not yet well-known program for Android. The standard interface for searching and selecting a wireless network in android is not super informative. It is minimalistic and does not provide complete information on the available WiFi hotspots. Of course, this icon with three signal levels may be enough for someone, but there is a more convenient tool.

The main feature of WiFi Analyzer is a detailed display of the characteristics of each available WiFi point. It shows the exact level of the signal and the channels on which this point operates.
By the way about the channels. Those who have to tune frequently wireless routers, or if you want to get the maximum signal quality from your router, you will probably like the opportunity to assess the current situation with the employment of each WiFi channel in a second, and set the least loaded ones for your device.
And this application will also help in choosing the optimal location of the router in the office, apartment, and many other places. We leave our android wherever required best quality signal, move the router, watch the signal quality change in the application, move the router. Repeat several times until the best result is obtained. If necessary, you can view the statistics of the signal level from each available point.


For those who have not yet believed in the usefulness, I will give an example: through the standard android interface, you found 3 WiFi points with a signal level of 1 out of 3. Which one to choose? With this program, you can quickly assess the stability of even a low signal, and choose the most stable one.
Chip's opinion: Google promises a simple solution to maximize WLAN coverage in every home. With Google WiFi, the internet giant is making a real difference Hardware... The system is very easy to configure and offers high productivity even in the most remote corners of the apartment.
You can get the Google WiFi system with one, two or three "units" - their number depends on the size of your home. In the case of the kit we tested, we are talking about two "units" of Google WiFi, which together should provide complete WLAN signal coverage of an apartment of up to 100 square meters.
Compact and powerful
Dressed in white plastic clothes google system WiFi thanks to a quad-core processor and 512MB random access memory has a large enough power. At the same time, four antennas are built into Google WiFi - two for the 2.4- and two for 5-GHz band. According to the manufacturer, the system is capable of operating simultaneously in two bands and thus, in theory, maximum speed data transmission up to 1200 Mbps.
With Beamforming technology, the transmitter power can be further increased. In addition, two Gigabit ports can be used for LAN or WAN connections. Google WiFi uses WPA2-PSK as the encryption method, which is a modern standard.
Google WiFi: expands depending on the size of the apartment
All through the app
Setting up a WLAN system from Google is made exclusively through the application (Google WiFi), which is installed on a smartphone or tablet. At the same time, all user configuration actions are accompanied by a really good assistant. Even without his prompts, you must first connect one of the Google WiFi “units” to an electrical outlet and your Internet connection (an existing modem router or modem) - it will not be available through the integrated Google WiFi modem.
Then you should launch the setup application on your smartphone, which is equipped with an assistant. The app will find your Google WiFi “primary unit” via Bluetooth. Then use the camera to scan the QR code located on the back of the Google WiFi, after which the WLAN connection should be established.
Now you give your network a name, then set a password to connect to it - and you're done! Adding the second "unit" is as simple as plugging it into a power outlet, keeping your smartphone with Bluetooth turned on for a while, scanning the QR code - and you're done, too!
 Something more, something less: the Google WiFi app won't share a lot of information
 You Can't Do Much
Really a large number the application does not offer options for customization. You can prioritize specific user requests, create a guest network, add new Google WiFi devices, test your internet connection speed, and use a couple more features.
Moreover, it is the connection tests that show "heterogeneous" results: if a pure test of the Internet connection speed (measured by the LAN port of the primary "unit") gives the result in "real" numbers, then the quality of communication between individual "units" of the system is assessed by the application only by school marks ...
Everything is displayed clearly, intuitively, and graphically designed accordingly. But all this is not for those users who are engaged in network settings at a professional level! In particular, it will be in vain to look for the ability to manually set WLAN channels or change other settings in the network.
The best WLAN everywhere!
In day-to-day use, you really won't notice when your device "swaps" one Google WiFi "unit" for another - in this sense, the network is completely homogeneous. So, in our test apartment, we could not find a single "bottleneck" that previously met in one or another corner - the system invisibly and constantly connects you to the time you need at a given moment Google device WiFi.
Now the signal level is really very good everywhere, which is noted not only by subjective feelings, but also by the measurement results. google apps WiFi. Perhaps the automatic channel selection works very well here.
Alternative: More Power - Netgear ORBI AC3000 (RBK50-100PES)
Netgear, too, with its WLAN system, which costs about 27,000 rubles, promises the best WLAN coverage in all corners of your apartment or your home. Based on the results of our practical test, we can confirm that it works really well. At the same time, setting up the Orbi system is also very simple.
Often, the owners of Wi-Fi transmitters face the question of how you can check the signal strength. Since not everyone wants to buy a device specifically for these purposes, one author came up with a solution to how you can make such a device yourself. The device is very simple to manufacture and use, but its accuracy is much lower than specialized devices.
The idea of the device is very simple, you need to make an antenna that would receive a Wi-Fi signal and then translate it into EMF, and then, based on the current readings, you can draw a conclusion about the signal strength. As an oscillating circuit, a square of wire is used, to which a trimmer capacitor is connected. As for the load, a millivoltmeter acts as it.
Materials and tools:
- microwave diode in a ceramic case (D405 or D603 is suitable);
- ceramic capacitor (1 nF);
- trimmer capacitor (5-15 pF);
- soldering iron;
- multimeter;
- Soviet fork;
- sharpener;
- copper wire;
- a piece of PCB.
Manufacturing process:
Step one. Preparing the fork
To conveniently connect the device to a multimeter, the author decided to use an ordinary Soviet plug. To do this, you need to remove its cover and then grind off all protruding parts with a sharpener. Next, you need to take two pieces of copper wire and screw them to the plug contacts. A nanofarad capacitor must be soldered between the pins of the plug.

Step two. Antenna creation and installation
Now you need to take a piece of PCB of a suitable size and drill two holes, they are drilled approximately opposite the plug contacts. Further, the previously installed copper wires are inserted into these holes. To fix the wire, you need to solder to the PCB, then the design will be reliable.


Now you can start creating the antenna. One of the soldered copper wires must be separated from the common contact of the entire plate. The receiving frame will be located here. To create the antenna frames, you need to adhere to the drawing, in total you need to bend 3 squares of wire. The height of the first square should be 30 mm, the second 33 mm (it will act as an active vibrator). The third square will act as a reflector; it has a height of 34.5 mm. Of course, it is difficult to achieve such accuracy, but the more precisely the squares are bent, the better the device will work. To create squares, serifs are made on the wire, and then it is folded with pliers.
After the contacts are ready, they can be soldered to the board. The most extreme squares just need to be soldered to the plate itself, it is important to keep the distance. As for the central square, it must be soldered to the contact that was previously separated from the common conductive layer of the PCB.
Step three. Device check
To check the device, you need a bluetooth phone. The manufactured device is inserted into the multimeter and the voltage measurement mode is switched on. When you bring the phone to the antenna, numbers should appear on the multimeter. By moving the antenna, you need to achieve the highest voltage. Then the phone is gradually taken away, if the numbers fall, it means that the device is working correctly, and a frequency of 2.4 GHz was caught.
Of course, this device is not suitable for accurate measurements, but it will not be difficult to approximately determine the signal strength and find its source with the help of it. In the future, it is planned to equip the device with an additional amplifier, for example, it can be a microcontroller, which will allow even more thorough signal analysis.
Inhabitants of apartment buildings literally live surrounded by Wi-Fi networks, the number of which in some examples can reach several dozen. Another thing is that the signal strength of both available and unavailable wireless networks can differ significantly. Passing through walls, ceilings and other obstacles, electromagnetic waves emitted by the router lose some of their power, and even within the same apartment, especially in old houses, the so-called stalinkas, the signal level can vary from room to room.
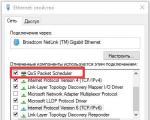
To determine the Wi-Fi signal strength in operating system Windows traditionally use indicators such as the system tray connection icon, but the information they provide is very rough. Five bars on the indicator is the best signal, presumably 100 percent, four bars are good, three are satisfactory, and so on downward. And since there are only five bars, we can assume that each of them is 20 percent of the power.
Is it possible to determine the signal strength more accurately and not by eye, but in numbers? Please, there is a netsh wlan show command for this. Run it running as administrator command line or PowerShell console. As a result, you will get a list of all the networks around you, including their parameters - SSID, type, channel used and test method and, of course, signal strength in percent. The signal level of the wireless network can also be determined by special programs, Wi-Fi Acrylic, for example, or inSSIDer, if you want to know the network power in dBm.