Mobile analytics. Comparison of mobile analytics systems: Mixpanel, Amplitude, Flurry, Localytics. Review of paid trackers
World market
Demographics play a significant role in the development of mobile analytics: more and more users within companies are familiar with mobile devices and the Internet from school, so as the staff of organizations gets younger, they will be the ones who will manage the further consumerization of IT. Gartner predicts that 33% of analytics will be used in the pocket by 2013. By the end of 2012, 55% of organizations using BI had already started or planned implementation mobile means data analysis. As a result, by 2015 the ratio of mobile and traditional BI projects will be 4:1.
According to a 2012 Dresner Advisory Services study for MicroStrategy, the role of mobile analytics has grown exponentially from 2010 to 2012. Thus, the number of study participants who are confident in the exceptional importance of mobile analysis tools increased from 52% to 61% over the indicated two years.
Mobile analytics penetration is uneven across vertical markets. Retailers and other trading companies give maximum importance to mobile BI; it is in this industry that there are already many positive examples of the implementation of mobile analysis tools. On the contrary, mobile analytics has a fairly low priority in the public sector, although there is successful experience here too.
Most study participants noted the penetration level of mobile analytics in their organizations at 10%, however, it should be noted here that in 2010, for the majority, this figure tended to zero. Companies have quite aggressive plans for the implementation of mobile BI solutions until 2015 - they are shown in the diagram below.
The study also looked at 25 key BI vendors offering mobile analytics solutions. The results of the analysis of these systems are presented below; out of a maximum of 36.5 points, the highest results were shown by MicroStrategy, Yellowfin, SAP and QlikTech.
Dresner Advisory Services, 2013
According to research company Ovum as of January 2013, the most functional solutions on the market are offered by MicroStrategy, Information Builders and Yellowfin, while mega-vendors like SAP provide the best mobile analytics systems for iOS devices.
As for mobile platforms, all BI vendors, without exception, support the Apple iOS platform; Android is in second place in terms of vendor support (90%), followed by the BlackBerry (50%) and Windows (33%) mobile operating systems. The Ovum report does not take into account systems running Windows 8, RT and Phone 8.
According to Frederica Tanwalla(Fredrik Tunvall), Ovum analyst, there is no doubt that the success of the iPad in the market has a significant impact on the product strategies of BI developers. Meanwhile, for mobile BI solutions to reach a larger audience, vendors will also have to create applications for the Windows and Android platforms, which are most widely used, especially in emerging markets.
While SAP has a head start in the mobile analytics market thanks to the company's acquisitions of Afaria, Syclo and Sybase, other vendors such as IBM, Oracle and SAS are also gradually gaining market share. To maintain their solutions at a competitive level, vendors will actively use an M&A strategy, says Tanvall. He also believes that innovation in the BI and analytics market will reach maximum level in the next few years.
Russian market
The growth of mobile analytics in Russia is accompanied by growing user interest in mobile versions of other classes of business systems. As the penetration of related hardware in the corporate segment increases, this phenomenon will eventually become widespread.
Thus, according to IDC forecasts from February 20013, in 2013 the Russian smartphone market will grow by approximately 15%. IDC believes that the Russian smartphone market is still far from saturation: the growth trend will continue for another two to three years, but by 2015 smartphones will not occupy 50% of the total phone market. The share of smartphones in the Russian phone market in 2012 increased from 25% to 33%.
In unit terms, at the end of 2012, 12.3 million smartphones were sold in Russia, reports J’son&Partners Consulting. Compared to 2011, sales growth reached 52%. The share of smartphones in total sales was 30%.
Also important role The development of the Russian market also plays a role tablet computers. According to Euroset, in 2012 it showed the maximum increase among all portable electronics - 366% and 256% in quantitative and monetary terms. According to various estimates, in 2013 tablet sales may reach 2-3 million units.
Today, almost all major BI vendors have mobile BI products in their product lines. Some vendors, for example, Oracle, have all the functionality of the main version of the analytical product available in the mobile version. Most of these solutions and tools are already available to Russian customers, which is an additional incentive for the development of mobile analytics. Unlike, for example, BI with open source, where many serious solutions are still not presented in Russia, and therefore cannot be assessed by potential customers.
Market participants note that if in 2011 mobile BI was more of a “nice addition” to the main project than an essential tool, then in 2012 the presence of such an application increasingly became a mandatory requirement for customers. Moreover, if at first the main users of mobile analytics were top management, investors and company owners, now projects are being implemented in Russia where mobile analytics works “in the field” - for example, with representatives of trading companies.
Vladimir Itkin, development director affiliate network Qlik (QlikTech) Russia, confirmed:“Today, every second client when choosing a BI platform and solution has a mandatory criterion - work on mobile devices. Just two or three years ago this was more of a bonus to the platform than a necessity. But mobile technologies They have firmly entered our lives, and now a tablet in the hands of an ordinary employee is not a luxury.”
According to him, the modern business user can no longer wait for the report to be prepared and sent to him by the IT service staff. He is already accustomed to receiving information at the right time for him, using the Internet and search tools, for example, Google. Requests are starting to grow, and mobile access to aggregated reports is also not enough; there is a growing need to see the detailed level of data. The speed of decision-making in a competitive environment depends on this, which will be especially important after Russia’s accession to the WTO.
Vladimir Itkin noted one more interesting fact: Recently, more than half of QlikTech partner pilot projects are tested by customers on mobile devices. “That is, before the final decision to purchase a platform is made, the client wants to make sure that the solution being created will not limit its capabilities in analysis when used on mobile devices,” the expert explained.
Sergey Shestakov, deputy general director for business development at Prognoz, told TAdviser that the company is very actively using mobile tools in its projects. In particular, Prognoz creates mobile versions of situation centers, program-targeted control systems, modeling and forecasting systems. At the same time, solutions based on the mobile version of Prognoz Platform allow you to work with information both online and offline: for example, on an airplane. All this functionality is implemented in the standard software product“Electronic executive office”, which the vendor brought to the market. So not only Western platforms have mobile BI tools.
On the other hand, added Sergey Shestakov, mobile analytics for mass consumption is practically not represented on the Russian market. “We regularly create and develop similar solutions for international organizations that use mobile applications to widely disseminate macroeconomic, environmental and other statistical data,” he explained. The IMF eLibrary, World Bank DataFinder applications and their various modifications are available for free download at App Store, including in Russia.
Expert "Prognoz" believes that such analytical products, designed for an unlimited number of end users and aimed directly at the Russian market, should appear in the near future.
Widely applicable mobile applications in a corporate environment, security policies and company concerns related to the transfer of mobile networks your data.
Examples in action
An example of the implementation of mobile BI is a mobile application for iPad based on the Prognoz Platform, which is used by the management of the Federal Tax Service of Russia. It displays detailed information on the activities of the Federal Tax Service divisions, operational indicators on tax revenues, debts that are formed in information system departments. The head of the Russian tax service, in particular, used this application when reporting to the Prime Minister of the Russian Federation.
Also, Dmitry Medvedev was recently presented with a solution created by Prognoz for monitoring investment activities in the North Caucasus Federal District. It includes, inter alia, the investment portal of the North Caucasus Federal District and its mobile version for iPad, which contains information for investors about investment opportunities and sites in the region, as well as existing measures state support and investment projects already being implemented in the North Caucasus.
In regional administration, the use of iPad applications is very common - the number of administrations of federal subjects that order similar solutions from us is in the dozens. For example, the leadership of the Lipetsk region was one of the first to use mobile technologies in daily work, using them to access a single repository of all regional information. In the Lipetsk Region Information Information System today there are more than 20 thematic subsystems (on territorial development, agriculture, social support, energy saving, etc.), on the basis of which summary analytical materials are provided to regional leaders via electronic tablets.
Compared popular mobile analytics systems: Mixpanel, Amplitude, Flurry, Localytics.
When developing mobile applications, we often integrate analytics services into them. We worked with the following systems:
In our opinion, these are the main decisions on this moment. The choice of an analytics system by our customers is influenced by several defining parameters:
- Real-time - how quickly events sent from the device appear in the analytics interface.
- Conversion funnels - their availability and convenience.
- Install tracking.
- External API - the ability to send data not only from the mobile application, but also from other sources. For example, from the server part or website.
- Price.
Let's look at each parameter in more detail.
Real-time
In some cases, it is important to see and analyze what is happening in the application with minimal latency. So, when updating, you can make changes that should increase conversion to the application interface.
Real-time analytics will allow you to understand how effective these changes were immediately after release, and not after some time.
Real-time data is provided by Mixpanel, Amplitude and Localytics. In the first two, events arrive with a delay of a couple of seconds. In Localytics - with a delay of several minutes.
Amplitude. User activity in real time
There is no real-time in Flurry. Data update frequency is not documented. On average, you have to wait a day for data sent to analytics. Conversion funnels, which we will discuss below, often take even longer to build. Once we had to wait about three days for the funnel to be recalculated.
Conversion funnels
Conversion funnels are one of the key tools in any analytics where quality indicators are important. For example, what percentage of users reached the product purchase screen and what percentage stopped at registration. All of the analytics systems mentioned in this article support funnels, but some do it better than others.
Mixpanel
When building a funnel in Mixpanel, you can impose conditions on each event in it. If we track registrations, then, for example, we can only count registrations through Facebook.
An already built funnel can be segmented according to the parameters of any of its events. You can define your own parameters and send them from the application along with the event itself. For example, an event is the click of a certain button in an application: we want to change its color and at the same time observe the change in user behavior depending on the change in color of the button. That is, the color of the button will be an event parameter.
It is also possible to observe how conversion changes over time, that is, the change in the percentage of users moving between different events within the funnel.
 Mixpanel. Weekly conversion from install to adding an entry in the What I Eat app
Amplitude
Just like in Mixpanel, you can impose a condition on each event from which a funnel is formed and observe the distribution of conversion over time.
In addition, there is an interesting and unusual feature - viewing users who passed or did not pass a specific funnel step along with the events that were received from them during the funnel passage.
 Amplitude. User steps inside the funnel
There are funnels, but they are more difficult to use than in other systems. The following reasons:
- Quick segmentation of users is possible only by already existing segments. If we want to add an additional segment to the funnel, then it will need to wait about a day for its calculation.
- There is no way to impose conditions on individual funnel steps.
- You can create a maximum of 10 segments.
- Construction and calculation of the funnel after creation takes about a day.
- There is a graph of conversion changes over time.
Localytics
Quite an unusual toolkit for working with funnels. If in Mixpanel and Amplitude everything is somewhat similar, then Localytics decided to approach the issue in its own way.
1. You can impose several conditions on a funnel step. This is convenient and essentially replaces the entire funnel segmentation functionality in the other three analytics.
 Localytics. Two conditions in the first step of the funnel
2. Determining the time range for the funnel is carried out by overlaying additional condition one step. There is no way to see the change in conversion over time on one graph.
3. The ability to watch events - for each step of the funnel (except the first), before and after it for past and unpassed users, respectively.
 Localytics. User actions before and after the selected step
4. Detailing of users who have completed the step, according to their parameters and a large number preset segments (platform, system version, country, language, etc.).
 Localytics. Segmentation of users at the funnel step by device
Install tracking
Tracking users between an ad and installing an app based on that ad allows you to understand which ad campaign is more effective and what users who click through it do.
It is not easy to implement such a mechanism in mobile applications. Because of this, it is not available in all analysts.
Mixpanel and Amplitude do not have this option out of the box, and for this you need to use third-party services that will send application installation data to analytics: for Mixpanel this is Adjust or AppsFlyer, for Amplitude - Adjust.
In Flurry, installation tracking is implemented natively, which is very convenient.
Localytics has built-in install tracking for some ad networks (Adwords, InMobi, Facebook, and others). To track users from another source that is not supported in analytics, you need to connect a third-party service - Adjust, AppsFlyer, Kochava and others.
External API
A common situation is when some of the data is sent to analytics from a mobile application, and some from the web backend. In this case, an interface (API) is needed through which the backend can send them.
Mixpanel and Amplitude implement an external API for sending events. In Flurry and Localytics - no.
Price
In order to simplify the price comparison, let's assume that all users of our system are active and each of them sends 5 events per day, 20 days per month (assumption for the case of non-daily user activity). Then 10,000 users will generate 1,000,000 events per month. Below is a table of analytics costs for 1 / 5 / 10 / 30 / 50 / 100 thousand users per month.
Let's collect the above in a table to summarize the data on analytical services:
We can't pick a winner or loser in this comparison. The choice of analytics very much depends on the features of the mobile application and the personal preferences of the developers.
Localytics has made available a free VentureBeat report, Mobile App Analytics: What the Winning Developers Are Using.
The company surveyed more than 230 app developers with more than 1 million users (a combined audience of 250 million people) to understand what solutions they use. In addition, MixRank data was studied for 1.8 million applications in Google Play and App Store.
Key provisions of the report
Google Analytics completely dominates Android. 1.5 million applications use this SDK (with a sample of 1.6 million applications, 91.58% of applications). All other analytics systems are almost at the level of arithmetic error.
On iOS, the install base ranking is led by Flurry (36.07%), but there is not such a clear leader as in the case of Android. Second place goes to Google Analytics (28.89%), third place to Crashlytics (7.61%). The main obstacle for Fluryy is that it is very slow.
Two out of three developers use big single analytics. For large publishers, using 3-5 tools is a common picture.
Despite Google's leadership in the install base, it is the main analytics platform for only 30% of developers. Most publishers use many other services as their “main ones” - , IBM Analytics, Crashlytics, comScore, Clicktale, AppSee, Apsalar, Amplitude, etc.
If you take not the number of installations, but the quality of applications, user ratings, and look at what analytics are used there, the picture changes dramatically. For Android, the main (maybe not always noticeable) competitors of the two leaders are: , Tune (HasOffers), Amazon, and . For iOS – Kochava, Mixpanel and Tune (HasOffers). They “participate” in the creation of higher-quality applications, although they are orders of magnitude less widespread than the leaders. It is these platforms that help create the best applications.
For iOS, the analytical summary Top looks like this:
- Flurry
- Google Analytics
- Crashlytics
- TestFlight
- Localytics
- Adobe Marketing
- Tune/HasOffers
- comScore
For Android Top analytics:
- Google Analytics
- Flurry
- Crashlytics (Twitter)
- Umeng
- HockeyApp
- Localytics
- Mixpanel
- Tune/HasOffers
- comScore
- Amazon (Insights and A/B Testing)
What metrics are most important to developers and their marketers? Quantity active users, installs, returns, ARPU and LTV. They use more – the number of active users, installations, returns, failures and session length.
They do not use metrics - distribution, launch time, failures, user reviews, ARPU.
What is mobile analytics used for? Increase user engagement, improve monetization, collect data and improve user experience.
For analytics, the most important things are reliability, speed, feature set and ease of use.
Top analytics according to developers:
- Localytics
- Flurry
- Mixpanel
- Amazon
- comScore
- Adobe
- Apsalar
- Crashlytics
Find out how users who install your app find your app's page in the app store.
Install tracking allows you to collect and transfer information from mobile applications to your Google Analytics account, after which it appears in the report on mobile application traffic sources.
To set up tracking of mobile app installs, you must follow the steps below.
ContentStep 1: Enable tracking of app installs in your account
For Android
Installation tracking Android applications automatically included in Google Analytics. No action is required on your part.
For iOS
To set up installation tracking in Google account Analytics, follow these steps:
- Click Administrator and navigate to the required resource.
- In column RESOURCE click Resource settings.
- In chapter Campaign tracking for iOS applications set the switch to position ON.
- Click the button Save.
Step 2: Update the Google Analytics Developer Kit
For Android
Android developers need to change a few lines in the manifest file. An example is provided in the Android Developer Guide.
For iOS
Enter in the application necessary changes to use the Google Analytics Developer Kit for iOS. To track installs in Google Analytics, your app must have access to the iOS Identifier for Advertising (IDFA). To do this, you need to add the libAdIdAccess.a library to your XCode project. For details and examples, see the SDK Developer's Guide and README file.
Step 3: Set up custom campaigns
You need to set up specific campaigns for each platform you use. To make this task easier, we created a URL Builder. For more information about setting up custom campaigns, see the developer guides for your operating system.
For Android
For iOS
Further actions
Create and manage campaigns in the selected advertising network
Once you've set up mobile app install tracking in Google Analytics, you can begin developing your advertising strategy and ad content. How effectively you manage your campaigns will determine the number of users who download your app. You need to determine your target audience, your ad message, and the ad network you want to use.
Be sure to include a dedicated URL to the download page for each ad or campaign, and add tags to all ad URLs. This will help you figure out which ads are most effective at driving traffic to your download page.
Tracker— a mobile application analytics system with the ability to track the source of installations.
There are many things to consider when choosing a tracker. First of all, it’s worth understanding that there are two types of tracking: a system for tracking the install channel, as well as in-App analytics for analyzing demographics, geolocation or the length of a user’s session. The principle of tracking is simple. The user clicks on advertising banner(video, text ad), a redirect occurs, the tracker records the click in the system.
Screenshot from Yandex's presentation on the work of AppMetrics
What is an SDK?
Regardless of which tracker you choose, you need to implement it using the SDK.
SDK(software development kit) - a set of development tools that allows software specialists software create applications for a specific software package, basic development software, hardware platform, computer system, game consoles, operating systems and other platforms.
Simply put, code is generated inside each tracking system that will transfer data between the store, the application and the tracker itself. If you work only with the App Store and your application is paid, you can limit yourself to the built-in analytics of iTunes Connect. Then there is no need to implement anything additional. You can create tracking links right there. The algorithm is simple. 1. Go to “application analytics”.  2. Choose the right application. 3. In the “sources” section, select “create a link to the campaign.” 4. The system will transfer you to new tab, Where are you:
- select the application for which you are creating tracking;
- indicate the name of the advertising campaign;
- copy the link that the system generates.
 On the “Sources” tab, in the “Most Popular Campaigns” section, statistics on advertising campaigns will be displayed. Important:
- App Store analytics collects data only for devices with OS 8 and higher;
- The attribution window is 24 hours for campaigns;
- To display statistics there must be at least five unique application downloads.
Attribution— a method of transmitting the source of a click or conversion. Attribution Window— time interval between clicking on an ad and installing the application.
Which tracker should you choose?
Free solutions
1.
 We recommend that all clients install a free solution from Google - Google Analytics for mobile applications. If the client’s activities are presented not only on mobile, but also on the desktop web, then this is generally a prerequisite. First, GA provides a comprehensive view of traffic distribution. Secondly, you can create Google Ads remarketing lists, which is still the leader in Runet as a source of traffic. The standard attribution window, as for web versions, is 30 days. Initially, the system is not designed to work with mobile applications, so it cannot calculate full-fledged cohort analysis or funnels. However, Google strives to improve its products, and this is noticeable in the number of updates over the past year. It is worth noting that Google Analytics has a powerful set of APIs, which allows you to receive much more information than when working in the interface.
This tracking method is available for: Android, iOS, Windows, Unity.
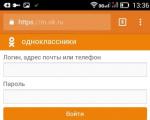
2. Yandex.Metrica for applications or AppMetrica
 Relatively New Product on the mobile market, but at the same time quite functional. AppMetrica provides a symbiosis of functions that is convenient to work with - the system can send postbacks and at the same time analyze user behavior. Analytics is integrated with many advertising networks, which greatly simplifies tracking when working with a large number of sources. The system uses several attribution models: Device Identifier Matching (48-hour window) and Device Fingerprint Matching (click attribution can take up to 10 days). The first model involves integration with advertising networks and adds two parameters to the tracking link, which allow you to record the installation only after it is opened. And Device Fingerprint Matching links ad clicks with installs. Tracking is available for: Android, iOS, Windows, Unity.
3. Yahoo Flurry
 Flurry and Google Analytics are competitors. Often developers are faced with a choice between these two solutions. Flurry allows you to track everything that GA does. One of the advantages of the system is that it works with events, which are quite easy to set up, and the ability to set the period for the implementation of a step when setting up a funnel. The reports inside the analytics are well organized, you can create the necessary segments and funnels. The disadvantages include the lack of calculation of financial indicators and the ability to conduct A/B testing. We can conclude that the system is not at all suitable for those who have in-app purchases in the application. The attribution window is 48 or 72 hours, depending on whether the system receives the device ID or not. Tracking is available for: Android, iOS, Unity (difficult to integrate).
4. Facebook Analytics
The system allows you to track the effectiveness of advertising campaigns on Facebook. Installs and even in-app conversions are tracked. The standard attribution window on Facebook is 28 days. This means that conversions will be credited to the ad within 28 days of the ad being clicked. This method of tracking installs can significantly distort the real picture, so it is better to change the attribution window in conversion reports. Select “customize columns”: 
 Tracking is available for: Android, iOS, Unity.
Review of paid trackers
A high-quality tracker is quite expensive. And all because paid solutions analyze traffic sources more accurately.
1.AppsFlyer
 Paid tracker with a good reputation in the market. You can download a trial for 5,000 inorganic installs, more than 10,000 integrated partners, which makes it easier to work with paid traffic sources. Recently, AppsFlyer has learned to compare data on user activity during TV campaigns. The latter is a clear advantage for large brands that run national campaigns and want to measure their effectiveness. In addition, AppsFlyer makes it easy to measure conversions and in-app purchases, LTV, and even ROI. The cost calculator for a paid package for the Russian version of the site looks like this:
  The system calculates settings differently for different channels. The attribution window for Twitter is 14 days, Facebook is 28 days (read more about the difference in counting on Facebook), other advertising systems are 7 days. Trial is present. Available for: Android, iOS, Windows Phone, Amazon Apps, Unity.
2.Adjust
 If you buy a paid tracker package, you get standard reporting, API access, and organic install tracking as a bonus. When analyzing conversions in the application, please note that the number of installations has absolutely no correlation with the number of conversions themselves during this period. Event attribution is tied to the installation source throughout the entire lifecycle of a given user. Use to view statistics for a specific user. Plus - flexible payment systems that depend on the number of attributions recorded by the system. For large players there is an unlimited package. The standard attribution window is 7 days. To receive a trial version for 30 days, you need to send an application by email. Available for: Android, iOS, Windows, Unity.
3. Mobile App Tracking or Tune
![]() Satisfies almost any reporting request. Gives a clear understanding of how much income the installation brought, and also knows how to calculate the user’s LTV. The system has powerful API functionality that allows you to generate reports of any complexity. The system is so serious and extensive that it allows you to configure the attribution window for each partner separately. It is worth noting that such analytics are only suitable for advanced application owners. Otherwise, the amount of information received will simply be useless. Tune's functionality is extremely powerful, so its cost is even higher than AppsFlyer or Adjust. In addition, the tracker does not track installations from Facebook, so you won’t see the full picture. You can ask for a trial tracker on the website. Available for: Android, iOS, Windows, Unity.
Satisfies almost any reporting request. Gives a clear understanding of how much income the installation brought, and also knows how to calculate the user’s LTV. The system has powerful API functionality that allows you to generate reports of any complexity. The system is so serious and extensive that it allows you to configure the attribution window for each partner separately. It is worth noting that such analytics are only suitable for advanced application owners. Otherwise, the amount of information received will simply be useless. Tune's functionality is extremely powerful, so its cost is even higher than AppsFlyer or Adjust. In addition, the tracker does not track installations from Facebook, so you won’t see the full picture. You can ask for a trial tracker on the website. Available for: Android, iOS, Windows, Unity.
4.
 Like Tune, Mixpanel is a serious mobile analytics solution that is quite expensive. The site presents several tariff plans from $150 to unlimited (over 50 million events). The high cost of the tracker (for an application with volumes of 20 million events or more is $2000 monthly) is due to its capabilities:
- financial analytics;
- in-App analytics;
- detailed segmentation;
- classic funnel;
- well-designed cohort analysis.
The standard attribution window is 30 days and, just like in Tune, it can be adjusted. Among the advantages of Mixpanel is the ability to send push notifications and targeted messages to any application audience. Trial is present. Available for: Android, iOS, Windows, Unity.
conclusions
We have compiled a table comparing tracker functions: 
In my opinion, when classic version application promotion the best option is free Google Analytics and paid tracker. This combination will allow you to accurately track the source of installations and optimize advertising campaigns, as well as provide an understanding of user behavior after installing the application. We will be glad to hear your opinion in the comments. Write which tracker you are working with and why.
Overview of other tracking services and general summary table -