Raid controllers lsi. Comparative review of six SAS RAID controllers. Virtual machine tests
How many connectors should there be on the controller?
It hurts! Almost every day I see questions like this: “You can put 16 (24) on the server hard drives, and I only have an 8-port (or worse, 4-port) SAS RAID controller! What should I do? This is probably a configuration error?!” Well, what can you say to this? This could of course be a mistake, but most likely not. How so? And everything is very simple: SAS is a serial data transfer protocol that supports switching. If you need to connect 7 workstations to the server, you don’t put 7 in the server network cards, but you are using an 8-port switch that allows all machines to access the server. It’s exactly the same in this situation: either in the case itself (right on the backplane) or in the form of a separate card there is an analogue of this very switch. Only in this case it is called a SAS expander and allows you to connect many more disks to the RAID controller than there are SAS lines on the controller itself. The most common expanders based on LSI chips are: LSISASx28, LSISASx36 or LSISAS2x36 (for 6Gbps SAS). In particular, LSI expanders are used on backplanes in Supermicro cases. Separate cards with expanders also exist; for example, in Russia the easiest way to find them is among the products of the company Chenbro.
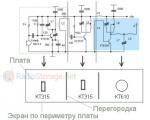
 The figure shows a possible connection diagram with two RAID controllers for fault tolerance to disks through an expander. True, it must be said that this is a rather specific configuration that we usually see in external disk systems, but servers use more simple circuit, in which there is neither a second controller nor a second expander.
It seems like we’ve figured it out - to connect 24 disks you don’t need 24 ports on the controller, 4 are enough (since usually 4 SAS lines are used to connect the controller to the expander). And using a controller with 4 internal ports and 4 external ones, you can not only use (when using an expander) all the disks in the server, but also provide the ability to further increase the disk subsystem by adding an external disk enclosure (JBOD).
But several new questions immediately arise: “Is it necessary to use an expander? Maybe it slows down work so much that it needs to be abandoned? I have as many as 24 (or even more) disks connected only via 4 SAS lines - it will probably be very slow?”
Let's try to find the answers. Let's start from the end: 4 SAS lines at 3Gbps give a total of 12Gbps, and this is as much as 1.5 Gigabytes per second. Is it really possible to achieve this throughput? In principle, it is possible, but (a) you need to remember that you probably need to do something else with this stream, and not just read or write, and (b) this will require (even under favorable circumstances) noticeably more than a dozen disks. And if we take into account that when typical job server, requests to the disk subsystem are largely random, then a bandwidth of 12Gbps turns out to be quite enough - you can check it yourself on any of your servers by running perfmon (under Windows) and looking at the transfer from disks during operation. As for the occurrence of additional delays when using expanders, of course they exist, but you will not be able to “catch” (measure) them - they are so small compared to the delays when accessing the hard drive. There is another argument not to be afraid of expanders - in RAID controllers, where the number of ports is more than 8, this is often explained by the presence of an expander integrated on the board - for example Adaptec
Tests of RAID 6, 5, 1 and 0 arrays with Hitachi SAS-2 drives
Apparently, gone are the days when a decent professional 8-port RAID controller cost quite a lot of money. Nowadays, solutions have appeared for the Serial Attached SCSI (SAS) interface, which are very attractive in terms of price, functionality, and performance. This review is about one of them.
LSI MegaRAID SAS 9260-8i controller
Previously, we already wrote about the second generation SAS interface with a transfer speed of 6 Gbit/s and the very cheap 8-port HBA controller LSI SAS 9211-8i, designed for organizing entry-level data storage systems based on the simplest RAID arrays SAS and SATA- drives. The LSI MegaRAID SAS 9260-8i model will be a higher class - it is equipped with more powerful processor with hardware processing of arrays of levels 5, 6, 50 and 60 (ROC technology - RAID On Chip), as well as a significant volume (512 MB) of on-board SDRAM memory for effective data caching. This controller also supports SAS and SATA interfaces with a data transfer rate of 6 Gbps, and the adapter itself is designed for PCI Express x8 version 2.0 (5 Gbps per lane), which is theoretically almost enough to satisfy the needs of 8 high-speed SAS ports. And all this at a retail price of around $500, that is, only a couple of hundred more expensive than the budget LSI SAS 9211-8i. The manufacturer himself, by the way, refers this decision to the MegaRAID Value Line series, that is, economical solutions.


LSIMegaRAID SAS9260-8i 8-port SAS controller and its SAS2108 processor with DDR2 memory
The LSI SAS 9260-8i board has a low profile (MD2 form factor), is equipped with two internal Mini-SAS 4X connectors (each of them allows you to connect up to 4 SAS drives directly or more via port multipliers), is designed for the PCI Express bus x8 2.0 and supports RAID levels 0, 1, 5, 6, 10, 50 and 60, dynamic SAS functionality and much more. etc. The LSI SAS 9260-8i controller can be installed both in 1U and 2U rack servers (Mid and High-End class servers), and in ATX cases and Slim-ATX (for workstations). RAID support is provided in hardware - an integrated LSI SAS2108 processor (PowerPC core at 800 MHz), complemented by 512 MB of DDR2 800 MHz memory with ECC support. LSI promises processor speeds of up to 2.8 GB/s for reading and up to 1.8 GB/s for writing. Among the rich functionality of the adapter, it is worth noting the functions Online Capacity Expansion (OCE), Online RAID Level Migration (RLM) (expanding the volume and changing the type of arrays on the fly), SafeStore Encryption Services and Instant secure erase (encrypting data on disks and securely deleting data ), support solid state drives (SSD Guard technology) and many others. etc. An optional battery module is available for this controller (with it the maximum
working temperature should not exceed +44.5 degrees Celsius).
| LSI SAS 9260-8i controller: basics | specifications |
| System interface | PCI Express x8 2.0 (5 GT/s), Bus Master DMA |
| Disk interface | SAS-2 6 Gbit/s (supports SSP, SMP, STP and SATA protocols) |
| Number of SAS ports | 8 (2 x4 Mini-SAS SFF8087 connectors), supports up to 128 drives via port multipliers |
| RAID support | LSI SAS2108 ROC (PowerPC @ 800 MHz) |
| Built-in cache memory | 512 MB ECC DDR2 800 MHz |
| Energy consumption, no more | 24 W (+3.3 V and +12 V power from PCIe slot) |
| Operating/Storage Temperature Range | 0…+60 °С / −45…+105 °С |
| Form factor, dimensions | MD2 low-profile, 168×64.4 mm |
| MTBF value | >2 million h |
| Manufacturer's warranty | 3 years |
The manufacturer outlined typical applications for the LSI MegaRAID SAS 9260-8i as follows: various video stations (video on demand, video surveillance, video creation and editing, medical images), high-performance computing and digital data archives, various servers (file, web, email, databases). In general, the vast majority of problems solved in small and medium-sized businesses.

In a white and orange box with a frivolously smiling, toothy lady's face on the “title” (apparently to better attract bearded system administrators and stern system builders) there is a controller board, brackets for installing it in ATX, Slim-ATX cases, etc., two 4-disk cable with Mini-SAS connectors on one end and regular SATA (without power) on the other (for connecting up to 8 drives to the controller), as well as a CD with PDF documentation and drivers for numerous Windows versions, Linux (SuSE and RedHat), Solaris and VMware.
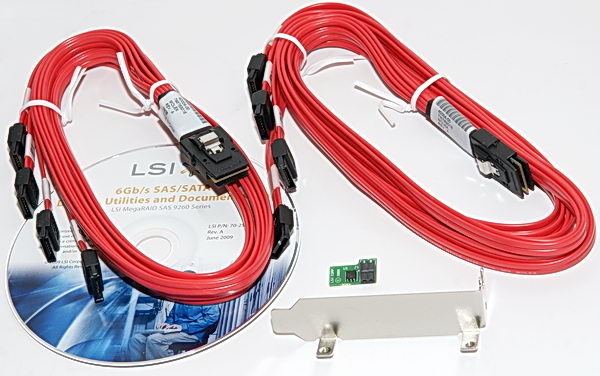
Delivery set for the boxed version of the LSI MegaRAID SAS 9260-8i controller (mini MegaRAID Advanced Services Hardware Key is available upon separate request)
Available with a special hardware key (supplied separately) for the LSI MegaRAID SAS 9260-8i controller software technologies LSI MegaRAID Advanced Services: MegaRAID Recovery, MegaRAID CacheCade, MegaRAID FastPath, LSI SafeStore Encryption Services (their consideration is beyond the scope of this article). In particular, in terms of increasing the performance of a traditional disk array (HDD) using a solid-state drive (SSD) added to the system, MegaRAID CacheCade technology will be useful, with the help of which the SSD acts as a second-level cache for the HDD array (analogous to a hybrid solution for HDD), in some cases, providing up to a 50-fold increase in disk subsystem performance. Also of interest is the MegaRAID FastPath solution, which reduces the processing latency of I/O operations by the SAS2108 processor (by disabling optimization for HDDs), which allows you to speed up the operation of an array of several solid-state drives (SSDs) connected directly to the SAS 9260-8i ports.
It is more convenient to perform operations on configuring, setting up and servicing the controller and its arrays in a proprietary manager in the operating system environment (the settings in the BIOS Setup menu of the controller itself are not rich enough - only basic functions are available). In particular, in the manager, with a few clicks of the mouse, you can organize any array and set policies for its operation (caching, etc.) - see screenshots.


Examples of screenshots of the Windows manager for configuring RAID arrays of levels 5 (above) and 1 (below).
Testing
To get acquainted with the basic performance of the LSI MegaRAID SAS 9260-8i (without the MegaRAID Advanced Services Hardware Key and related technologies), we used five high-performance SAS drives with a spindle speed of 15 thousand rpm and support for the SAS-2 interface (6 Gbit/ c) - Hitachi Ultrastar 15K600 HUS156030VLS600 with a capacity of 300 GB.

Hitachi Ultrastar 15K600 hard drive without top cover
This will allow us to test everything basic levels arrays - RAID 6, 5, 10, 0 and 1, not only with the minimum number of disks for each of them, but also “for growth”, that is, when adding a disk to the second of the 4-channel SAS ports of the ROC chip. Note that the hero of this article has a simplified analogue - the 4-port LSI MegaRAID SAS 9260-4i controller on the same element base. Therefore, our tests of 4-disk arrays are equally applicable to it.
The maximum sequential read/write speed of payload data for the Hitachi HUS156030VLS600 is about 200 MB/s (see graph). The average random access time when reading (according to specifications) is 5.4 ms. Built-in buffer - 64 MB.

Hitachi Ultrastar 15K600 HUS156030VLS600 sequential read/write speed chart
The test system was based on Intel processor Xeon 3120, motherboard With Intel chipset P45 and 2 GB DDR2-800 memory. The SAS controller was installed in the PCI Express x16 v2.0 slot. The tests were carried out under the control of operating rooms Windows systems XP SP3 Professional and Windows 7 Ultimate SP1 x86 (pure American versions), since their server counterparts (Windows 2003 and 2008, respectively) do not allow some of the benchmarks and scripts we used to work. The tests used were AIDA64, ATTO Disk Benchmark 2.46, Intel IOmeter 2006, Intel NAS Performance Toolkit 1.7.1, C’T H2BenchW 4.13/4.16, HD Tach RW 3.0.4.0 and for Futuremark PCMark Vantage and PCMark05. Tests were carried out both on unpartitioned volumes (IOmeter, H2BenchW, AIDA64) and on formatted partitions. In the latter case (for NASPT and PCMark), the results were taken both for the physical beginning of the array and for its middle (array volumes of the maximum available capacity were divided into two equal-sized logical partitions). This allows us to more adequately evaluate the performance of solutions, since the fastest initial sections of volumes, on which file benchmarks are carried out by most browsers, often do not reflect the situation on other sections of the disk, which can also be used very actively in real work.
All tests were carried out five times and the results were averaged. We will look at our updated methodology for evaluating professional disk solutions in more detail in a separate article.
It remains to add that during this testing we used controller firmware version 12.12.0-0036 and drivers version 4.32.0.32. Write and read caching has been enabled for all arrays and disks. Perhaps the use of more modern firmware and drivers saved us from the oddities noticed in the results of early tests of the same controller. In our case, such incidents were not observed. However, the FC-Test 1.0 script (which in certain cases to the same colleagues “I would like to call confusion, vacillation and unpredictability”), we also do not use it in our package, since we have previously repeatedly noticed its inconsistency on some file patterns (in particular, sets of many small, less than 100 KB, files).
The charts below show the results for 8 array configurations:
- RAID 0 of 5 disks;
- RAID 0 of 4 disks;
- RAID 5 of 5 disks;
- RAID 5 of 4 disks;
- RAID 6 of 5 disks;
- RAID 6 of 4 disks;
- RAID 1 of 4 disks;
- RAID 1 of 2 disks.
By RAID 1 array of four disks (see screenshot above), LSI obviously means a stripe+mirror array, usually referred to as RAID 10 (this is confirmed by test results).
Test results
In order not to overload the review web page with a countless set of diagrams, sometimes uninformative and tiring (which is often the fault of some “rabid colleagues” :)), we have summarized the detailed results of some tests in table. Those who want to analyze the subtleties of our results (for example, find out the behavior of the participants in the most critical tasks for themselves) can do this on their own. We will focus on the most important and key test results, as well as on average indicators.
First, let's look at the results of “purely physical” tests.
The average time for random data access when reading on a single Hitachi Ultrastar 15K600 HUS156030VLS600 disk is 5.5 ms. However, when organizing them into arrays, this indicator changes slightly: it decreases (thanks to effective caching in the LSI SAS9260 controller) for “mirror” arrays and increases for all others. The largest increase (about 6%) is observed for Level 6 arrays, since in this case the controller has to simultaneously access the largest number of disks (three for RAID 6, two for RAID 5 and one for RAID 0, since the access in this test occurs in blocks of only 512 bytes, which is significant smaller size array interleaving blocks).
The situation with random access to arrays during writing (in blocks of 512 bytes) is much more interesting. For a single disk, this parameter is about 2.9 ms (without caching in the host controller), however, in arrays on the LSI SAS9260 controller, we observe a significant decrease in this indicator - thanks to good write caching in the controller's 512 MB SDRAM buffer. Interestingly, the most dramatic effect is obtained for RAID 0 arrays (random write access time drops by almost an order of magnitude compared to a single drive)! This should undoubtedly have a beneficial effect on the performance of such arrays in a number of server tasks. At the same time, even on arrays with XOR calculations (that is, a high load on the SAS2108 processor), random write accesses do not lead to obvious performance degradation - again thanks to the powerful controller cache. It is natural that RAID 6 is slightly slower here than RAID 5, but the difference between them is essentially insignificant. The behavior of a single “mirror” in this test was somewhat surprising, as it showed the slowest random write access (perhaps this is a “feature” of the microcode of this controller).
The speed graphs for linear (sequential) reading and writing (in large blocks) for all arrays do not have any special features (for reading and writing they are almost identical, provided that the controller write caching is enabled) and they are all scaled according to the number of disks participating in parallel in the “useful » process. That is, for a five-disk RAID 0 disk the speed is “quintupled” relative to a single disk (reaching 1 GB/s!), for a five-disk RAID 5 it is “quadrupled”, for RAID 6 it is “tripled” (triples, of course :)), for RAID 1 of four disks it doubles (no “y2eggs”! :)), and for a simple mirror it duplicates the graphs of a single disk. This pattern is clearly visible, in particular, from the indicators maximum speed reading and writing real large (256 MB) files in large blocks (from 256 KB to 2 MB), which we illustrate with a diagram of the ATTO Disk Benchmark 2.46 test (the results of this test for Windows 7 and XP are almost identical).
Here, the only thing that unexpectedly dropped out of the overall picture was the case of reading files on a RAID 6 array of 5 disks (the results were rechecked many times). However, for reading in 64 KB blocks the speed of this array gains the required 600 MB/s. So let’s attribute this fact to a “feature” of the current firmware. Note also that when writing real files, the speed is slightly higher due to caching in a large controller buffer, and the difference with reading is more noticeable, the lower the actual linear speed of the array.
As for the interface speed, usually measured by buffer writing and reading (multiple accesses to the same disk volume address), here we are forced to state that for almost all arrays it turned out to be the same due to the inclusion of the controller cache for these arrays (see . table). Thus, the recording performance for all participants in our test was approximately 2430 MB/s. Note that the PCI Express x8 2.0 bus theoretically gives a speed of 40 Gbit/s or 5 GB/s, however, according to useful data, the theoretical limit is lower - 4 GB/s, which means that in our case the controller actually worked on version 2.0 of the PCIe bus. Thus, the 2.4 GB/s we measured is obviously real throughput onboard memory of the controller (DDR2-800 memory with a 32-bit data bus, as can be seen from the configuration of the ECC chips on the board, theoretically gives up to 3.2 GB/s). When reading arrays, caching is not as “comprehensive” as when writing, which is why the “interface” speed measured in utilities is usually lower than the read speed of the controller cache memory (typical 2.1 GB/s for arrays of levels 5 and 6) , and in some cases it “falls” to the speed of reading the buffer itself hard drives(about 400 MB/s for a single hard drive, see the graph above), multiplied by the number of “sequential” disks in the array (these are just the cases of RAID 0 and 1 from our results).
Well, we have sorted out the “physics” to a first approximation, it’s time to move on to the “lyrics”, that is, to tests of “real” application guys. By the way, it will be interesting to find out whether the performance of arrays scales when performing complex user tasks as linearly as it scales when reading and writing large files (see the ATTO test diagram just above). The inquisitive reader, I hope, has already been able to predict the answer to this question.
As a “salad” for our “lyrical” part of the meal, we will serve desktop-by-nature disk tests from the PCMark Vantage and PCMark05 packages (under Windows 7 and XP, respectively), as well as a similar “track” test of applications from the reputable German package H2BenchW 4.13 C'T magazine. Yes, these tests were originally created to evaluate desktop hard drives and low-cost workstations. They emulate the execution of typical advanced tasks on disks. personal computer- working with video, audio, Photoshop, antivirus, games, swap files, installing applications, copying and recording files, etc. Therefore, their results in the context of this article should not be taken as the ultimate truth - after all, Multi-disk arrays perform other tasks more often. However, in light of the fact that the manufacturer itself positions this RAID controller, including for relatively low-cost solutions, such a class of test tasks is quite capable of characterizing a certain proportion of applications that will actually be executed on such arrays (the same work with video, professional graphics processing, swapping OS and resource-intensive applications, copying files, antivirus, etc.). Therefore, the importance of these three comprehensive benchmarks in our overall package should not be underestimated.
In the popular PCMark Vantage, on average (see chart), we observe a very remarkable fact - the performance of this multi-disk solution almost does not depend on the type of array used! By the way, within certain limits, this conclusion is also true for all individual test tracks (types of tasks) included in the PCMark Vantage and PCMark05 packages (see the table for details). This may mean either that the controller firmware algorithms (with cache and disks) hardly take into account the specifics of this type of application, or that the bulk of these tasks are performed in the cache memory of the controller itself (and most likely we are seeing a combination of these two factors ). However, for the latter case (that is, executing tracks to a large extent in the cache of the RAID controller), the average performance of the solutions is not so high - compare these data with the test results of some “desktop” (“chipset-based”) 4-disk RAID 0 and 5 and inexpensive single SSDs on the SATA 3 Gb/s bus (see review). If, compared to a simple “chipset” 4-disk RAID 0 (and on twice as slow hard drives as the Hitachi Ultrastar 15K600 used here), LSI SAS9260 arrays are less than twice as fast in PCMark tests, then relative to not even the fastest “budget” single SSDs definitely outperform them all! The results of the PCMark05 disk test give a similar picture (see table; there is no point in drawing a separate diagram for them).
A similar picture (with some reservations) for arrays on LSI SAS9260 can be observed in another “track” application benchmark - C’T H2BenchW 4.13. Here, only the two slowest (by design) arrays (RAID 6 of 4 disks and a simple “mirror”) noticeably lag behind all other arrays, the performance of which obviously reaches that “sufficient” level when it no longer rests on the disk subsystem, and the efficiency of operation of the SAS2108 processor with the controller cache memory for these complex sequences of calls. What makes us happy in this context is that the performance of arrays based on LSI SAS9260 in tasks of this class is almost independent of the type of array used (RAID 0, 5, 6 or 10), which allows the use of more reliable solutions without compromising the final performance.
However, “Maslenitsa is not all for the cat” - if we change the tests and check the operation of arrays with real files on file system NTFS, then the picture will change dramatically. Thus, in the Intel NASPT 1.7 test, many of the “preset” scenarios of which are quite directly related to tasks typical of computers equipped with an LSI MegaRAID SAS9260-8i controller, the disposition of the arrays is similar to what we observed in the ATTO test when reading and writing large files - performance increases proportionally as the “linear” speed of the arrays increases.
In this chart we show the average for all NASPT tests and patterns, while in the table you can see detailed results. I would like to emphasize that we ran NASPT both under Windows XP (this is what many browsers usually do) and under Windows 7 (which, due to certain features of this test, is done less frequently). The fact is that Seven (and its “big brother” Windows 2008 Server) use more aggressive caching algorithms when working with files than XP. In addition, copying of large files in Semerka occurs mainly in blocks of 1 MB (XP, as a rule, operates in blocks of 64 KB). This leads to the fact that the results of the Intel NASPT “file” test differ significantly in Windows XP and Windows 7 - in the latter they are much higher, sometimes more than twice! By the way, we compared the results of NASPT (and other tests in our package) under Windows 7 with 1 GB and 2 GB of installed system memory (there is information that with large amounts of system memory, caching of disk operations in Windows 7 is enhanced and NASPT results become even higher) , however, within the limits of measurement error, we did not find any difference.
We leave the debate about which OS (in terms of caching policies, etc.) to test disks and RAID controllers under for the discussion thread of this article. We believe that drives and solutions based on them need to be tested under conditions that are as close as possible to the real situations of their operation. That is why, in our opinion, the results we obtained for both operating systems are of equal value.
But let's return to the average performance chart in NASPT. As you can see, the difference between the fastest and slowest arrays we tested here is on average just under three times. This, of course, is not a five-fold gap, as when reading and writing large files, but it is also very noticeable. The arrays are located in fact proportional to their linear speed, and this is good news: this means that the LSI SAS2108 processor processes data quite quickly, creating almost no bottlenecks when the arrays of levels 5 and 6 are actively working.
To be fair, it should be noted that in NASPT there are patterns (2 out of 12) in which the same picture is observed as in PCMark with H2BenchW, namely that the performance of all tested arrays is almost the same! These are Office Productivity and Dir Copy to NAS (see table). This is especially obvious under Windows 7, although for Windows XP the trend of “convergence” is obvious (compared to other patterns). However, in PCMark with H2BenchW there are patterns where there is an increase in the performance of arrays in proportion to their linear speed. So everything is not as simple and unambiguous as some might like.
At first, I wanted to discuss a chart with general array performance indicators averaged over all application tests (PCMark+H2BenchW+NASPT+ATTO), that is, this one:
However, there is nothing special to discuss here: we see that the behavior of arrays on the LSI SAS9260 controller in tests that emulate the operation of certain applications can vary dramatically depending on the scenarios used. Therefore, it is better to draw conclusions about the benefits of a particular configuration based on exactly what tasks you are going to perform. And another professional test can significantly help us with this - synthetic patterns for IOmeter, emulating a particular load on the data storage system.
Tests in IOmeter
In this case, we will omit the discussion of numerous patterns that carefully measure the speed of operation depending on the size of the access block, the percentage of write operations, the percentage of random accesses, etc. This is, in fact, pure synthetics that provides little useful practical information and is of interest rather purely theoretically. After all, we have already clarified the main practical points regarding “physics” above. It is more important for us to focus on patterns that emulate real work - servers various types, as well as file operations.
To emulate servers such as File Server, Web Server and DataBase (database server), we used the same and well-known patterns proposed at one time by Intel and StorageReview.com. For all cases, we tested the arrays with command queue depth (QD) from 1 to 256 in increments of 2.
In the “Database” pattern, which uses random disk access in 8 KB blocks within the entire volume of the array, one can observe a significant advantage of arrays without parity (that is, RAID 0 and 1) with a command queue depth of 4 and higher, while all arrays with parity control (RAID 5 and 6) demonstrate very similar performance (despite the twofold difference between them in the speed of linear accesses). The situation can be explained simply: all arrays with parity control showed similar values in tests for average random access time (see the diagram above), and it is this parameter that mainly determines the performance in this test. It is interesting that the performance of all arrays increases almost linearly with increasing command queue depth up to 128, and only at QD=256 in some cases can a hint of saturation be seen. Maximum performance arrays with parity control at QD=256 was about 1100 IOps (operations per second), that is, the LSI SAS2108 processor spends less than 1 ms to process one piece of data of 8 KB (about 10 million single-byte XOR operations per second for RAID 6; of course , the processor also performs other tasks in parallel for data input/output and working with cache memory).
In the pattern file server, using blocks of different sizes with random read and write access to the array within its entire volume, we see a picture similar to DataBase with the difference that here five-disk arrays with parity (RAID 5 and 6) are noticeably faster than their 4-disk counterparts analogues and demonstrate almost identical performance (about 1200 IOps at QD=256)! Apparently, adding a fifth disk to the second of the controller's two 4-channel SAS ports somehow optimizes the computing load on the processor (at the expense of I/O operations?). It may be worth comparing the speed of 4-disk arrays when the drives are connected in pairs to different Mini-SAS connectors of the controller in order to identify the optimal configuration for organizing arrays on the LSI SAS9260, but this is a task for another article.
In the web server pattern, where, according to its creators, there are no disk write operations as a class (and therefore no calculation of XOR functions per write), the picture becomes even more interesting. The fact is that all three five-disk arrays from our set (RAID 0, 5 and 6) show identical performance here, despite the noticeable difference between them in the speed of linear reading and parity calculations! By the way, these same three arrays, but with 4 disks, are also identical in speed to each other! And only RAID 1 (and 10) falls out of the overall picture. Why this happens is difficult to judge. Perhaps the controller has very efficient algorithms sampling of “lucky disks” (that is, those of the five or four disks from which the necessary data arrives first), which in the case of RAID 5 and 6 increases the likelihood of data arriving from the plates earlier, preparing the processor in advance for the necessary calculations (remember the deep queue commands and a large DDR2-800 buffer). And this can ultimately compensate for the delay associated with XOR calculations and equalizes their “chances” with “simple” RAID 0. In any case, the LSI SAS9260 controller can only be praised for its extremely high results (about 1700 IOps for 5-disk arrays at QD=256) in the Web Server pattern for arrays with parity. Unfortunately, the fly in the ointment was the very low performance of the two-disk “mirror” in all these server patterns.
The Web Server pattern is echoed by our own pattern, which emulates random reading of small (64 KB) files within the entire array space.
Again, the results were combined into groups - all 5-disk arrays are identical to each other in speed and are leaders in our “race”, 4-disk RAID 0, 5 and 6 are also indistinguishable from each other in terms of performance, and only “DSLRs” fall out of the general masses (by the way, a 4-disk “DSLR”, that is, RAID 10 turns out to be faster than all other 4-disk arrays - apparently due to the same “selecting a successful disk” algorithm). We emphasize that these patterns are valid only for a large depth of the command queue, while with a small queue (QD = 1-2) the situation and leaders can be completely different.
Everything changes when servers work with large files. In the conditions of modern “heavier” content and new “optimized” operating systems such as Windows 7, 2008 Server, etc. Working with megabyte files and 1 MB data blocks is becoming increasingly important. In this situation, our new pattern, which emulates random reading of 1-MB files within the entire disk (details of the new patterns will be described in a separate article on the method), comes in handy to more fully evaluate the server potential of the LSI SAS9260 controller.
As we can see, the 4-disk “mirror” here leaves no hope for leadership, clearly dominating any queue of commands. Its performance also initially grows linearly with increasing command queue depth, but at QD=16 for RAID 1 it reaches saturation (speed of about 200 MB/s). A little “later” (at QD=32) performance “saturation” occurs in the slower arrays in this test, among which “silver” and “bronze” have to be given to RAID 0, and arrays with parity control find themselves as outsiders, losing even before brilliant RAID 1 of two disks, which turns out to be unexpectedly good. This leads us to the conclusion that even when reading, the computational XOR load on the LSI SAS2108 processor when working with large files and blocks (randomly located) turns out to be very burdensome for it, and for RAID 6, where it actually doubles, it is sometimes even prohibitive - The performance of the solutions barely exceeds 100 MB/s, that is, 6-8 times lower than with linear reading! “Redundant” RAID 10 is clearly more profitable to use here.
When randomly recording small files, the picture is again strikingly different from what we saw earlier.
The fact is that here the performance of the arrays practically does not depend on the depth of the command queue (obviously, the huge cache of the LSI SAS9260 controller and the rather large caches of the hard drives themselves have an effect), but it changes radically with the type of the array! The undisputed leaders here are the “simple ones” for the RAID 0 processor, and the “bronze” with more than two times the loss to the leader is for RAID 10. All arrays with parity control formed a very close single group with a double-disc DSLR (details on them are given in a separate diagram under the main one), losing three times to the leaders. Yes, this is definitely a heavy load on the controller processor. However, frankly speaking, I did not expect such a “failure” from the SAS2108. Sometimes even software RAID 5 on a “chipset” SATA controller (with caching) using Windows and calculation using central processor PC) is able to work faster... However, the controller still produces “its” 440-500 IOps consistently - compare this with the diagram for average access time when writing at the beginning of the results section.
The transition to random writing of large 1 MB files leads to an increase in absolute speed indicators (for RAID 0 - almost to the values for random reading of such files, that is, 180-190 MB/s), however, the overall picture remains almost unchanged - arrays with parity many times slower than RAID 0.
A curious picture for RAID 10 is that its performance decreases with increasing command queue depth, although not by much. For other arrays there is no such effect. The two-disc “mirror” here again looks modest.
Now let's look at patterns in which files are read and written to disk in equal quantities. Such loads are typical, in particular, for some video servers or during active copying/duplication/backup of files within one array, as well as in the case of defragmentation.
First - 64 KB files randomly throughout the array.
Some similarity with the results of the DataBase pattern is obvious here, although the absolute speeds of the arrays are three times higher, and even at QD=256 some performance saturation is already noticeable. A larger (compared to the DataBase pattern) percentage of write operations in this case leads to the fact that arrays with parity and a two-disk “mirror” become obvious outsiders, significantly inferior in speed to RAID 0 and 10 arrays.
When moving to 1 MB files, this pattern is generally preserved, although absolute speeds approximately triple, and RAID 10 becomes as fast as a 4-disk stripe, which is good news.
The last pattern in this article will be the case of sequential (as opposed to random) reading and writing of large files.
And here many arrays already manage to accelerate to very decent speeds in the region of 300 MB/s. And although the more than twofold gap between the leader (RAID 0) and the outsider (two-disk RAID 1) remains (note that with linear reading OR writing this gap is fivefold!), RAID 5 entered the top three, and the remaining XOR arrays did not catch up may not be reassuring. After all, judging by the list of applications of this controller that LSI itself provides (see the beginning of the article), many target tasks will use exactly this type of access to arrays. And this is definitely worth considering.
In conclusion, I will provide a final diagram in which the indicators of all the IOmeter test patterns mentioned above are averaged (geometrically for all patterns and command queues, without weighting coefficients). It is curious that if the averaging of these results within each pattern is carried out arithmetically with weighting coefficients of 0.8, 0.6, 0.4 and 0.2 for command queues 32, 64, 128 and 256, respectively (which conditionally takes into account the drop in the share of operations with high command queue depth in general work drives), then the final (for all patterns) normalized array performance index will coincide within 1% with the geometric mean.
So, the average “hospital temperature” in our patterns for the IOmeter test shows that there is no escape from “physics and mathematics” - RAID 0 and 10 are clearly in the lead. For arrays with parity control, a miracle did not happen - although the LSI SAS2108 processor demonstrates In some cases, decent performance, in general, such arrays cannot “reach” the level of a simple “stripe”. At the same time, it is interesting that 5-disk configurations clearly add value compared to 4-disk configurations. In particular, 5-disk RAID 6 is definitely faster than 4-disk RAID 5, although in terms of “physics” (random access time and linear access speed) they are virtually identical. The two-disk “mirror” was also disappointing (on average it is equivalent to a 4-disk RAID 6, although the mirror does not require two XOR calculations for each bit of data). However, a simple “mirror” is obviously not a target array for a fairly powerful 8-port SAS controller with a large cache and a powerful on-board processor. :)
Pricing information
The LSI MegaRAID SAS 9260-8i 8-port SAS controller with a complete set is offered at a price of around $500, which can be considered quite attractive. Its simplified 4-port analogue is even cheaper. A more accurate current average retail price of the device in Moscow, relevant at the time you read this article:
| LSI SAS 9260-8i | LSI SAS 9260-4i |
|---|---|
| $571() | $386() |
Conclusion
Summarizing what was said above, we can conclude that we will not risk giving uniform recommendations “for everyone” regarding the 8-port LSI MegaRAID SAS9260-8i controller. Everyone should draw their own conclusions about the need to use it and configure certain arrays with its help - strictly based on the class of tasks that are supposed to be launched. The fact is that in some cases (on some tasks) this inexpensive “mega-monster” is capable of showing outstanding performance even on arrays with double parity (RAID 6 and 60), but in other situations the speed of its RAID 5 and 6 clearly leaves much to be desired . And salvation (almost universal) will only be RAID array 10, which can be organized with almost the same success on cheaper controllers. However, it is often thanks to the processor and cache memory of the SAS9260-8i that the RAID 10 array behaves no slower than a stripe of the same number of disks, while ensuring high reliability of the solution. But what you should definitely avoid with the SAS9260-8i is a two-disk “mirror” and 4-disk RAID 6 and 5 - these are obviously suboptimal configurations for this controller.
Thanks to Hitachi Global Storage Technologies
for the hard drives provided for testing.
High-performance 6-Gb/s hardware RAID controller 9260-8i with 8 internal ports (2 SFF8087 connectors) and 512MB of built-in memory, allowing you to connect up to 128 SAS and SATA drives with RAID-on-Chip technology.
The MegaRAID SATA+SAS 9260 line of high-performance products allows you to achieve the highest data transfer speeds of up to 2880MB/s read, 1850MB/s write and up to 147,000 I/O operations with random access to data, which allows you to run even the most demanding applications, such as like databases and video processing.
These products enable the use of 3 Gb/s and 6 Gb/s media with support for internal connection of both SATA and SAS drives.
Internal connection of SATA or SAS drives of the server. Allows you to work with 128 devices using SAS expanders. LSI RAID-on-Chip (ROC) technology and core PCI interface Express for applications that require high bandwidth.
Optional battery backup to prevent data loss in case of server failure.
Supports additional software CacheCade, FastPath and Recovery/Snapshots.
Key Features
- Maximum available performance level: read mode: 2.875 MB/s, write mode: 1.850 MB/s
- PCI Express 2.0 provides higher signal speeds for high-bandwidth applications
- Maximum solution flexibility due to disk support SATA drives and SAS 3Gbit/s and 6Gbit/s
- SafeStore Encryption technology provides stronger data protection
- MD2's low-profile design fits easily into compact 1U and 2U architectures
Specifications
| Parameter | Description |
| RAID support | LSISAS2108 RAID-on-Chip (ROC) 800MHz PowerPC® |
| Performance | Up to 6Gbps per port |
| Interfaces | Eight internal SATA+SAS ports |
| Memory | Cache - 512MB DDRII (800MHz) |
| Number of supported devices | up to 32 SATA and/or SAS disk drives |
| Supported RAID Levels | RAID - level 0, 1, 5 and 6 Extended RAID 10, 50 and 60 |
| Host Controller Interface | X8 PCI Express version 2.0 |
| Form factor | Low profile MD2 format (167.64 mm x 64.42 mm) |
| Functionality | Emergency power supply (optional, direct connection) Automatic resume after upgrade Automatic resume after recovery Online Capacity Expansion (OCE) Online migration from one to another RAID level (RLM) SafeStore Data Coding System Immediate data deletion feature SSD support with SSD Guard™ technology Global and dedicated backup, emergency hot backup with data recovery function Automatic recovery Structural integrity for hot standby SATA Emergency Hot Standby for SAS Arrays Multi-channel support structure for one controller (failover) Load distribution Complex software for managing RAID arrays |
Dear customers.
Please note that the reference information about products posted on this website does not constitute an offer; the availability and cost of equipment must be clarified with the managers of NAG LLC, who will be happy to help you in choosing equipment and placing an order for it.
The manufacturer reserves the right to change appearance, technical specifications and equipment without notice.