1c 8.3 external report document selection. Adding an external report to the database. Formation of reports in the context of documents
Reporting is one of the main functions of any accounting system. What types of reports exist in 1C Accounting 3.0, how reports are configured in 1C Accounting 8.3 and what tools exist for creating new reports - we will consider today.
Types of standard reports
In the accounting program of 1C firm, a wide range of reports is initially pre-installed, which allow you to receive all the necessary information. Their full list is presented in the section "Reports / Standard reports":
Also, in each section of the program, other types of standard reports are presented, for example, salary reports in 1C 8.3 are stored in the "Salary and personnel / Salary reports" section.
In each report there is the possibility of "customizing" the report, namely, you can add or remove some additional fields, add grouping, selection, etc.
Let's consider the setting option by the example of adding an additional field to the standard report "Balance sheet by account" (select account 10). To do this, from the "Show settings" button go to "Additional fields", add a new field, and in the selection form go to the field we need, for example, to reflect the item number in the report, select the "Item number" field, which is located inside the "Nomenclature" field (to expand the field, you need to click "+"):

After clicking "Generate", an additional field selected by us appears.
As an example, let us consider a situation when the report needs to include the entire list of nomenclature containing the word “boots” in the name. What do I need to do? By clicking "Show settings", go to the "Selection" tab, add a new field, and in the window that appears, expanding the "+" field "Nomenclature", select "Name".
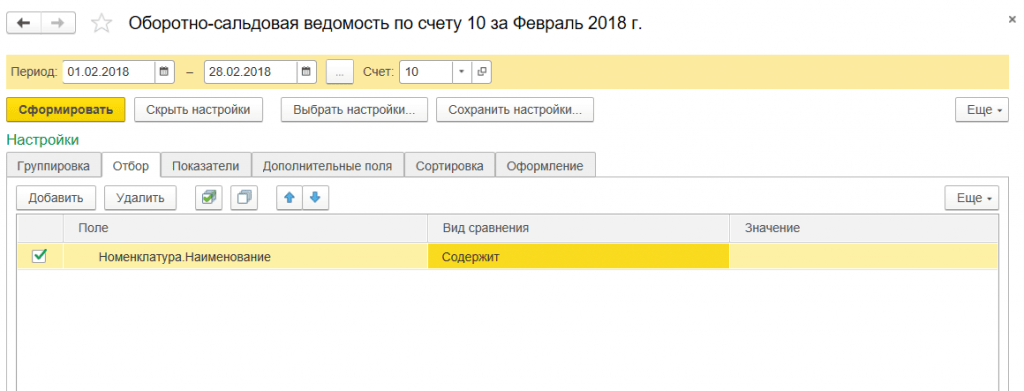
After generating the report, we get the nomenclature, which contains in the name only the value we have specified.
Formation of reports in the context of documents
In the section "Standard reports" there is a universal report that allows you to display information from such configuration objects as:
- Document;
- Directory;
- Accumulation register;
- Information register;
- Calculation register.
Let's consider examples of situations when a report will help the user not to resort to the development of external reports, but to use a typical settings mechanism.
For example, we need to generate a report that will reflect all received goods from a specific counterparty for a certain period. To do this, in the report header, select from the drop-down list the type of object - "Document", the type of object - "Receipt (acts, invoices)", and specify the type - "Goods".
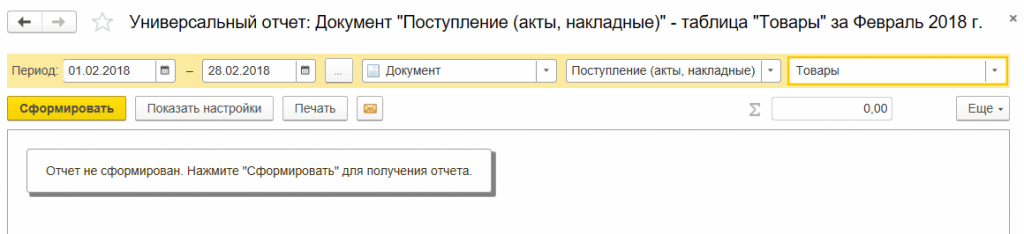

* Initially, the Counterparty field is not there.
In the field "Comparison type" set "Equal", in "Value" select the required counterparty from the directory.

At the top of the report, indicate the required period and generate a report.

For the settings we have made, you can save: for this, press the "More / Save" button.
Let us consider a situation when, for the correct formation of regulated reporting, it is required to check all movements in the register "Separate VAT accounting" in the context of documents.
To do this, in the report header, select the object type - "Accumulation register" from the drop-down list, in the next field select the object type - "Separate VAT accounting", in the last field, select the type - "Balances and turnovers".
In order for the information to be reflected in the report in the context of documents, click the "Show settings" button to go to the report settings, then to the "Indicators" tab, add a new field and in the window that appears, select the "Registrar" field ("Registrar" is a document that the movement on the accumulation register was formed). The newly added field is displayed by default at the bottom of the list of fields: using the "blue arrows" move the "Registrar" field to the top of the list.

In this article, we examined what options exist for working with reporting in 1C Accounting 8, how to use the report settings and what information can be obtained using a universal report.
Consider creating an external report in 1c 8 without using a data composition system. To create an external report, we will use the Accounting 2.0 configuration, the initial data: “Write a report on account 62, which will display the turnovers for the specified period in the context Counterparties and Contractor agreements.
1. Create a report
First of all, we will create an external report file, for this we go to 1c 8 in the mode Configurator, go to the menu File -> New, or click on the icon new document.
In the list, select the item External report... After creating the external report, give it a Name (for example Simplest Report) and save it to disk. We will also add two props: Beginning of period and End of Period type date, we will need them to limit the time interval for data sampling when generating a report.

2. Creating a layout for an external report
To generate a report in 1c 8, you need a layout, this is a template for outputting data in which all the necessary parameters are set, tables are drawn, etc. Let's add a new layout, for this, in the report metadata tree, select the item Layouts and press the button Add, when creating, select the type for the layout Spreadsheet document.

Our layout will have 4 areas:
- Header - in this area we will display the name of the report, the period for which it was generated and the header of the table;
- DataContractor - in this area we will display data on the counterparty in the table;
- Contractor Agreement Data - in this area we will display data on the counterparty agreement in the table;
- Basement - in this area we will display the totals for the entire report for the Income and Expense fields.
Let's start creating areas of the layout. In order to create an area in the layout, select the required number of lines and press Table Menu -> Names -> Assign Name(Or Ctrl + Shift + N). To the area A cap write the name of the report: Turnover 62 accounts, draw with the tool Borders report header, as well as set parameters Beginning of period and End of Period... Using the parameters, you can display the necessary data in the report, we will deal with this at the next stage of development, namely, when writing the program code of the report. To create a parameter in the layout, select the desired cell, write the name of the parameter (without spaces) in it, right-click on it, select the item in the menu that opens Properties... In cell properties on a bookmark Layout select filling Parameter.

After that, the parameter name in the cell will be enclosed in angle brackets (”<>“). As a result, the area A cap should look like this:

In the area of DataContractor we will create parameters for displaying the name of the counterparty, as well as for the income and expense for 62 accounts, using the tool Borders Let's arrange the area in the form of a table row.
In the area of DataContractor Agreement we will create parameters for displaying the name of the contract, as well as for receipts and expenditures on account 62, using the Borders tool, we will arrange the area in the form of a table row. Let's make a small indent in front of the parameter Contractor's Agreement(This can be done by splitting and merging cells. Right-clicking on a cell -> To combine or Break cell), it is needed so that it can be seen in the report that the line under the contract is lower in the hierarchy than the line for the counterparty.
In the area of Basement Let's create parameters for receipts and expenditures totals.
As a result, we should get a layout like this:

3. Creating a report form
To output data, set the formation period and buttons To shape our report will need a form. To create a form, find the item in the metadata tree of the external report. Forms and press the button Add... On the first page of the form designer, you do not need to make any changes, you just need to click the button Further.

On the next page of the constructor, we will select both available props ( Beginning of period, End of Period) for positioning on the form.

As a result, we get the following form:

But in this form, it does not suit us, we will make some changes to it:
- Drag the button To shape from the bottom pane of the report to the top one (this will be more convenient for the user);
- Stretch the shape vertically and horizontally;
- Arrange the fields Beginning of period and End of Period horizontally;
- Add to the form a control element Field of a spreadsheet document (our report will be displayed in it), give it a name TabDoc;
- Let's create a button for selecting a period (when you press it, a dialog with a convenient choice of the required period will be displayed). We will not write the program code for it yet, so we will simply place the button next to the fields of the period.
As a result, our form will look like this:

4. Programming
After creating the report form, let's start programming. To begin with, we will create a procedure for displaying the period selection dialog (we have already created a button for this in the previous step). Right-click on the button and select the menu item Properties, in the properties of the button, go to the tab Developments, where, using the button with the magnifying glass icon, create a procedure Button 1 Press in the form module.

You can switch between the form and its module using the tabs at the bottom of the form

To call the period selection form, we will use the standard procedure Accounting 2.0 from the general module WorkingWith Dialogs - HandlerSettingPeriodPressing, you need to pass the report details into it as parameters Beginning of period and End of Period.
Procedure Button 1 Press (Element) WorkingWith Dialogues.HandlerSettingPeriodPressing (BeginPeriod, EndPeriod); End of ProcedureNow let's move on to writing the code that will generate and display our report. There is already a procedure in the form module ButtonShapePress which will be executed when the button is pressed To shape, that's where we will write our code. Let's start by initializing the required variables. First of all, let's create a variable for spreadsheet document fields into which we will output the data, this is not necessary, just the recording of calls to it will become shorter, which means the program code will be more understandable for reading.
TabDoc = Form Elements.TabDoc;
Get the layout of the external report using the function Get Layout (<ИмяМакета>) , we will pass the name of the layout to the parameter, and if such a layout exists, then the function will find it.
Layout = Get Layout ("Layout");
After the layout is received, we will create variables for each of its areas, we will use the layout method for this GetArea (<ИмяОбласти>) .
AreaHeat = Layout.GetArea ("Header"); ScopeDataContractor = Layout.GetScope ( "DataContractor"); ScopeDataContract = Layout.GetScope ("ContractData"); AreaFooter = Layout.GetArea ("Footer");
Let's clear the field of the spreadsheet document. This is necessary so that with each new generation of the report, the old data is deleted.
TabDoc.Clear ();
Now that the initialization of the variables is complete, let's move on to alternately filling and displaying areas of the layout. Let's start with the cap. If you remember, we created two parameters in this area Beginning of period and End of Period, we will transfer the values of the report generation period there, for this we will use the property Options area of the layout.
AreaHead.Parameters.StartPeriod = StartPeriod; AreaHead.Parameters.EndPeriod = EndPeriod;
No more action on the area A cap the manufacturer is not necessary, so we display its field in the spreadsheet document.
TabDok.Display (AreaHap);
Next, we will write a query to the database, with which we will take the turnovers on the account 62 from the accounting register Self-supporting... Let's define a variable in which our request will be located.
Request = new Request;
Before we start writing the request text, let's pass the required parameters to it. Since we are writing an invoice request 62 accounting, then first of all we will create a parameter for it
Request.SetParameter ("Account62", Account Plans. Self-supporting.FindByCode ("62"));
It is also necessary to transfer the report generation period to the request. Do not forget that for the formation period we have special details of the report, and we pass them as parameters.
Request.SetParameter ("PeriodBeginning", PeriodBeginning); Request.SetParameter ("EndPeriod", EndPeriod);
Let's start writing the request text, we will do this using the query constructor. Many tutorials write that you need to be able to write a query both manually and using a constructor, but in practice this is not the case. In the tasks that are constantly faced by the 1C programmer, the priority is to quickly and efficiently write code, and when making a request to the database manually, this is almost impossible to achieve, you will spend a lot of precious time trying to correctly reproduce all query constructs, find typos which you did while writing, etc. Therefore, do not waste your time trying to write queries by hand, but use the query constructor. It will save you time and allow you to write complex queries effortlessly. To start writing the request text, write in the code:
Request.Text = "";
After that, put the cursor between the quotes, press the right mouse button and select the item Constructor request. The query designer window will open.

Now we need to select the table of the 1C 8 database we need. We need a virtual table Turnovers accounting register Self-supporting... Let's find it on the left side of the constructor window

Let's move it to the area Tables and let's fill in the parameters. For all virtual query tables, there is a special set of parameters that allow you to select the desired data from the main table (in our case, the main table Accounting Register Self-supporting). Let's open the virtual table parameters window.

Let's fill in the parameters of the period that we passed to the request. To use a parameter in the request text, write the symbol before its name ampersand (&)

It remains to fill in the condition for the account bukh. accounting. To do this, find the line in the parameters of the virtual table Account Condition and write there
Account in the HIERARCHY (& Account62)
You can also use the constructor for drawing up conditions by clicking on the button with three dots.

There is no need to impose any more conditions on the virtual table, so press the button OK in the virtual table parameters window. Next, you need to select the fields we need from the table Self-supporting.Turnovers(namely: Counterparty, Counterparty Agreement, Income and Expense). To see the list of fields available in the table we have selected, press the "+" symbol next to its name. After that, drag the required fields to the rightmost area of the query designer, which is called Fields. If we open the chart of accounts of accounting, we will see that for the account 62 analytics for Counterparty is Subconto1 and by Contractor's Agreement - Subconto2.

Therefore, from the fields of the virtual table, we select Subconto1 and Subconto2... Since we need the income and expense by the amount, we also select the fields AmountTurnoverDt and AmountTurnoverKt

Fill in the aliases of the fields we have chosen, for this we go to the tab Unions / Aliases and set the required field names.

Since in our report the data will be displayed hierarchically (the Counterparty is at the first level, and all his contracts are at the second), we will set up the data output in the hierarchy using Totals. Let's go to the bookmark in the constructor Outcomes... In the grouping fields, drag sequentially Counterparty and Contractor's Agreement, and in the final Coming and Consumption.

This completes the work in the query constructor, press the button OK and we see that the text of our request has appeared in the program code.
Request.Text = "SELECT | Self-supporting Turnovers.Subkonto1 AS a Counterparty, | Self-supportingTurnovers.Subkonto2 AS A Contract | Self-supportingTurnover.SumTurnoverDt AS Parish, | Self-supportingTurnover.SumTurnoverKt AS Consumption| FROM | Ledger of Accounting. Self-supporting.Turnovers (& Beginning of Period, & End of Period, Account IN HIERARCHY (& Account62),) AS Self-supporting Turnover| RESULTS | SUM (Arrival), | AMOUNT (Consumption) | Software | Counterparty, | Contractor's Agreement ";
After we have finished writing the request, let's start filling in the areas DataContractor, DataAgreementContractor and Basement... We will fill all these areas with the data obtained when executing the request. Since our query contains groupings ( Counterparty and Contractor's Agreement) select data from it as follows:
SelectContractor = Query.Run (). Select (QueryResultIndo.OnGroups);
Thus, we will receive records with totals for all counterparties.
Before traversing the sample data using a loop, we initialize the variables designed to calculate the total totals for the report:
TotalIncome = 0; Total Consumption = 0;
In order for the report data to be displayed with a hierarchy (and spreads along "+"), let us set the beginning of the autogrouping of the rows of the spreadsheet document:
TabDoc.StartAutoGroupLines ();
All preparations are over, now let's start traversing the query results. We will carry out the traversal using the loop Bye
While SampleContractor.Next () Cycle EndCycle;At the beginning of the cycle, set the parameters to zero Coming and Consumption areas DataContractor... What is it for? Imagine a situation that for a counterparty Uncle Vasya, income 10, and expense 5, and for it the next counterparty Uncle Petya there is neither income nor expense, in this case, if we do not reset the parameters Coming and Consumption, then by in line by counterparty Uncle Petya will get income 5 and expense 10.
ScopeDataContractor.Parameters.Prihod = 0; ScopeDataContractor.Parameters.Expense = 0;
After that we fill the area DataContractor sample item data
FillPropertyValues (ScopeDataContractor.Parameters, SelectionContractor);
After filling with data, you can display the area in Spreadsheet document Since we use autogrouping of lines, we need to indicate the level of the line in the grouping (in our report there will be two levels, for contractors the first for contracts is the second).
TabDok.Withdraw (ScopeDataContractor, 1);
Now, for this counterparty, we will make a selection by his contracts.
SelectionContractorAgreement = SelectionContractor.Choose (BypassResultResult.On Groupings);
We will carry out the traversal using the loop Bye.
While SelectionContractor Agreement.Next () Cycle End of Cycle;In the cycle under contracts of counterparties, we will reset the parameters Coming and Consumption, fill the area Data Agreement from the selection and display it in a spreadsheet document at the second level of records.
ScopeDataContract.Parameters.Prihod = 0; ScopeDataAgreement.Parameters.Expense = 0; Fill inProperty Values (ScopeDataContract.Parameters, SelectionContractorAgreement); TabDok.Withdraw (ScopeDataContract, 2);
Also, in this cycle, we add the current values to the variables for calculating the total values for income and expense.
TotalIncome = TotalIncome + SelectionContractor Agreement.Income; TotalExpense = TotalExpense + SampleContractor Agreement.Expense;
This completes the output of the data in the area DataContractor, DataAgreementContractor completed, it remains to complete the autogrouping of the rows of the spreadsheet document.
TabDoc.FinishAutoGroupLines ();
Fully loops responsible for outputting data in the area DataContractor and DataAgreementContractor look like this:
TabDoc.StartAutoGroupLines (); While SampleContractor.Next () Cycle RegionDataContractor.Parameters.Prihod = 0; ScopeDataContractor.Parameters.Expense = 0; FillPropertyValues (ScopeDataContractor.Parameters, SelectionContractor); TabDok.Withdraw (ScopeDataContractor, 1); SelectionContractorAgreement = SelectionContractor.Select (BypassResultResult.On Groupings); While SelectionDogovKontragenta.Sleduyuschiy () Cycle ScopeDataDogov.Parametry.Prihod = 0; ScopeDataAgreement.Parameters.Expense = 0; Fill inProperty Values (ScopeDataContract.Parameters, SelectionContractorAgreement); TabDok.Withdraw (ScopeDataContract, 2); TotalIncome = TotalIncome + SelectionContractor Agreement.Income; TotalExpense = TotalExpense + SampleContractor Agreement.Expense; End of Cycle; End of Cycle; TabDoc.FinishAutoGroupLines ();
It remains to output the totals to the area Basement and display the area itself in Spreadsheet document.
AreaBoard.Parameters.TotalIncome = TotalIncome; AreaBoard.Parameters.TotalExpense = TotalExpense; TabDok.Display (Area Basement);
This completes the process of writing an external report for 1C 8 without using the ACS. Now it can be generated in 1C: Enterprise 8 mode and added to the directory ExternalProcessing You can download the report file considered in the article by.
Watch a video on creating an external printable for a managed application:
They say that the name 1C originally meant the phrase "one second", ie. programs should issue reports quickly, "in one second." The speed of the reports is very important, but it is even more important that the reports give the correct information - let's figure it out using the example of creating a simple report in 1C 8.3 based on the Trade Management 10.3 configuration. To create correct reports, it is desirable (even strongly recommended) to be able to configure 1C and be able to program a little in the internal language and the 1C query language, although, on the other hand, creating reports is a great opportunity to start mastering these skills.
This description is educational for understanding the basic principles of creating 1C reports
How to create a report in 1C 8.3
To create a report, you need to open 1C in the configurator mode, for this, in the 1C launch window, select the desired base in the list and click the Configurator button:
In the configurator itself, go to the File menu and select the New item:

In the menu that appears, select the External report item and press the OK button:

This will open a new report window. In the Name field, enter the name of the report, it must be without spaces and special characters:

How to make a report using a layout
This method most of all requires programming skills in 1C, but here we will not analyze the mechanisms for receiving and processing data, we will make a simple report in order to understand the mechanism for launching a report and displaying a report form on the screen:
In the report window (which opens when creating a report) in the lower list, place the cursor on the Layouts item and, by right-clicking, click Add in the menu that appears:

In the opened layout designer, you can specify the name of the layout, the type of layout should be Spreadsheet Document, and then click the Finish button in the designer:

This will open a layout window that resembles an Excel sheet:

In this layout, you need to create areas - groups of rows or columns that the program will use as templates, substitute data received from the database in them and display these templates on the screen, thereby collecting the report together from these parts.
Let's make a report displaying a list of the nomenclature. To do this, we will create two areas of the layout: the report header and the item line.
To create a header area, left-click on the line header (where the line number is indicated) to select the line like this (the entire line must be selected with one click on the header):

After that, go to the Table menu of the main menu, go to the Names submenu and click on the Assign name item:

The program will prompt you to specify the Name of the area, the name should also not contain spaces and special characters, then click OK, it should look like this:

Now, in the created area, you need to enter the text that will be displayed in the report and format it. To do this, enter the text in the first cell, for example "List of nomenclature". Working with cells is similar to Excel.
To format the text in a cell, right-click on the cell and click on Properties. The cell properties window will open on the right. Scrolling down the contents of the window, find the Font field and click on the "..." button:

In the window that opens, in the Style section, check the Bold box and click the OK button:

The layout should look like this:

In the same way, we create the area of the item line, just do not highlight it in bold:

In the line area, you must indicate that the Name is a parameter, i.e. that the real name of the item will be inserted there when the report is output. To do this, open the properties of the cell with the name and in the properties in the Filling field select the Parameter value, this completes the layout setting:

We return to the main window of the report and in the lower list, right-click on the Forms item and click Add:

In the opened report form constructor, press the Finish button, the report form will open, double-click on the Generate button:

As a result, the button properties window will open on the right side of the screen, in the Action field, click on the magnifying glass:

After that, the form module will open, in which you need to program the generation of the report:

First, insert the following code instead of the selected text:
// create a spreadsheet document that will be filled with parts of the report and displayed on the screen
TabDocument = New TabularDocument;
// further, we get the layout that was created when creating the report
Layout = Get Layout ("Layout");
// now you need to display the header of the report, for this we get the header area from the layout and display it in a spreadsheet document
AreaHeat = Layout.GetArea ("Header");
TabDocument.Display (AreaHap);
// using a query, we get a selection of item names that should be displayed in the report
Request = New Request;
Request.Text = "
| CHOOSE
| Name
| FROM
| Directory.Nomenclature
|";
// get the nomenclature line area from the layout - we will refer to it in a loop to display each item
AreaString = Layout.GetArea ("Line");
// process each item from the resulting selection in a loop
Selection = Query.Run (). Select ();
While Fetch.Next () Loop
// to display the next line, you need to specify the next name in the area parameter (we set the parameter itself when creating the layout)
RegionString.Parameters.Name = Selection.Name;
// the parameter was filled in, now you can display the string
TabDocument.Output (AreaString);
End of Cycle;
// the spreadsheet document is formed, now we display it on the screen
TabDocument.Show ("List of items");
When the text is copied into the form module, the lines starting with a double slash "//" will be highlighted in green - these are comments, they describe what each line of code does:

Let's summarize what lines of code are needed to generate a report:
- It is necessary to create a spreadsheet document, which will be filled with parts of the report and displayed on the screen, this is done by the line "TabDocument = New TabularDocument;"
- You need to get a report layout, from it we will get the structure of the report in parts (areas), this is done by the line "Layout = Get Layout (" Layout ")"
- To display each of the areas, you need to get it from the layout and display it in a spreadsheet document, this is done with the lines "AreaHap = Layout.GetArea (" Header ")" and "TabDocument.Out (AreaHap)"
- If you need to fill in the parameters, which become known only during program execution, then before displaying the area, you need to fill in such parameters, this is done by the line "AreaString.Parameters.Name = Selection.Name"
- And only when the spreadsheet document is filled with all the necessary parts of the report, it is displayed on the screen, this is done by the line "TabDocument.Show (" List of items ")"
And now you can check the report's work - open 1C in enterprise mode (1C: Enterprise button in the 1C launch window). In the main menu, go to the file menu, click Open:

Find and open the saved report file. In the form that opens, click the Generate button:

and we get a list of the nomenclature:

This is just one of the ways to create reports in 1C. In the following articles, we will analyze others.
Let's consider the process of creating a report in 1C 8.3 using the Data composition system. For example, let's take the following task: the report must enter data from the tabular section of the goods of the documents Sales of goods and services for a certain period and for the selected organization. He must also group data by the Counterparty, Document Link and Nomenclature fields.
An example of the resulting report can be downloaded from.
Using the File-> New menu, add a new external report, give it a name and save it to disk. Let's create a data composition schema using the Open data composition schema button.
Writing a 1C request for ACS
After creating the layout diagram, we need to write a query that will collect data for the report. To do this, on the Datasets tab, create a Query dataset.

Now you can start writing a query; there is a special field for it in the dataset. You can write both manually and using a constructor (which is more convenient by an order of magnitude). In our report, the request is the simplest:
| CHOOSE | RealizationGoodsServicesTovary.Link, | RealizationGoodsServicesTovary.Link.Organization, | RealizationGoodsServicesTovary.Slink.Contractor, | RealizationGoodsServicesTovary.Nomenclature, | Realization of GoodsServicesTovary.Summa, | RealizationGoodsServicesTovary.StavkaNDS, | RealizationGoodsServicesTovary.SummaNDS, | Realization of GoodsServicesGoods.Price | FROM | Document.RealizationGoodsServices.Tovary | HOW Implementation of GoodsServicesGoods | WHERE | RealizationGoodsServicesTovary.Link.Data | BETWEEN & Beginning of Period AND & End of Period | And RealizationGoodsServicesTovary.Link.Organization | = & Organization
Setting up dataset fields
After writing a request, ACS will automatically fill in the table with field settings.

I will briefly tell you about some of the settings:

Configuring Resources
Resource fields in the data composition system are fields whose values are calculated based on the detailed records included in the grouping. In essence, resources are group or general totals of the report. In our case, the resources will be the Amount and VAT Amount fields. Resource totals can be calculated using ACS expression language functions, the simplest of which are Sum (), Average (), Maximum (), Minimum (), and Quantity (). To set the report resources, go to the Resources tab and drag the required report fields into the resource table. After that, you need to specify an expression (in our case, the Sum ()), you can also select the groupings for which you want to see the totals for this resource, this can be done in the Calculate by… column.

Please note that you cannot create groupings by the fields selected in the resources.
All parameters specified in the request will be displayed on the Layout scheme parameters tab. In our case, these are the Beginning of Period, End of Period and Organization. Let's go through some of their settings:
- Columns Name, Title and Type are filled in automatically and you should not change their values unnecessarily;
- A list of values is available. If you want to pass a list to the parameter, you need to set this flag, otherwise only the first element of the list will get there.
- Meaning. Here you can specify a default value for the parameter. In our example, we will select the Elements value for the Organizations parameter (an empty link to the Organizations reference book).
- Include in available fields. If you clear this flag, the parameter will not be visible in the settings: in the selected fields, selection.
- Limited availability. The flag is responsible for the ability to set the parameter value in the ACS settings.

Setting up the structure of the report
Let's go to the Settings tab, here we can specify the groupings of the report, the fields displayed in the report, filters, sorts, etc. The statement of the task says that the report should group data by the fields: Account, Link and Nomenclature, we will indicate them one by one in the grouping area.

On the Selected fields tab, drag our resources (Amount, VAT Amount) from the available fields to the report fields.

Let's add filters by Counterparty and Nomenclature for the convenience of using the report. We will uncheck the flags of using the selection, the user will set them when required.

This completes the configuration of the report, now you can run it in enterprise mode.
Report generation
For a report on ACS in 1C, it is not necessary to create a form, the layout system itself will generate it. Open the report in 1C Enterprise 8 mode.

Before generating it, press the Settings button and fill in the parameter values. You can also set the selection, if necessary, change groupings, sorts, etc.


See also the video on creating reports on the ACS:
1C 8.3 reports is a special metadata object designed to form a user-friendly presentation of data from 1C database tables.
Let's figure it out how to set up reports, what they are for, how external reports differ from built-in ones, and how reports differ from processing.
In order to create or customize a report, you need to know the built-in and. Whatever one may say, at the heart of almost any report is the initial request that receives the data. We process and display this data in a user-friendly form.
Reports are the main thing in any information system, therefore 1C company paid close attention to the development of reports and created a large number of designers and mechanisms for their creation.
Consider the basic techniques for creating reports
How to make a report in 1C using a layout
Creating with a layout is the most routine way. However, it is often resorted to out of despair, tk. in this way, the developer completely prescribes each action in code, which means that we can do anything. Other mechanisms cannot boast of this.
But in this case, all the faddles, menus and other "bows" will have to be written manually, which is very time consuming.
Get 267 1C video tutorials for free:
Generating a Report Using the Output Form Designer
The output form constructor is a mechanism built into the platform that facilitates the development of a report. The constructor is only available for regular forms.

The designer is given the request and all the necessary parameters of the future report, and he, in turn, generates the modules and report forms. The mechanism is based on the object of the embedded language 1C 8.2 - Report Builder.
Generating a Report Using Generic Report
The universal report has great functionality, convenient settings interface, familiar to the user:

Reports based on the Data Composition System
This is the most progressive method of creating reports in 1C, recommended by 1C itself. appeared in the 1C platform in version 8.1.
ACS allows you to create simple reports without a line of programming at all, because it has a very flexible and functional designer for creating a data composition schema:

In all recent configurations, all reports are written using the data composition system.
How external reports differ from built-in ones
As it is written in the documentation - nothing. The external reporting engine was created in order to debug reports during development.
The only difference when developing a solution is that you cannot refer to an external report "by name", unlike an embedded report.
How the report differs from processing
In fact, practically nothing. The main difference is the purpose of using the object: reports are needed to display information, but to change information.
The main differences are in properties: in reports, you can specify the Basic Data Composition Scheme (ACS) and specify settings for saving report parameters.